Park City, UT

3 days / 6 sessions
Current Issues in Spine

February 2-4, 2017

757z468_shutterstock_398301025.jpg

February 24, 2017 OrthoSpineNews

SAN ANTONIO–(BUSINESS WIRE)–Tissue Regenix, the U.K.-based leader in regenerative medicine, has established its decellularization (dCELL®) Technology in wound care in the United States with plans to expand into other medical sectors. The company has opened up new possibilities in regenerative medicine in the U.K., applying its dCELL® Technology to several therapeutic applications. The company launched U.S. operations through their chronic and acute wound care product, DermaPure®, and will progress into other applications, including orthopedics in early 2018.

The patented dCELL® Technology is a multi-tissue regenerative medical platform which can be used in a wide range of medical applications to allow the body to regenerate critical tissue through utilizing decellularized animal and human biological materials. DNA and other cellular material are removed from the tissue, leaving the acellular scaffold intact. dCELL® Technology provides support for cell migration during the healing process all while preserving necessary tissue strength. It avoids rejection by the patient’s body and integrates into the host tissue without the use of harsh chemicals or treatments.

“We have seen first-hand how life changing these products have been in Europe, and we are thrilled to bring our dCELL® Technology to the United States to help a new population of patients heal faster and more effectively,” said Antony Odell, CEO of Tissue Regenix. “These solutions are bringing hope to people who have conditions that may otherwise be beyond repair.”

DermaPure®, the decellularized human dermis product from Tissue Regenix, is currently available in the U.S. for patients with hard-to-heal acute and chronic wounds. DermaPure is produced from donated human tissue and it is 99% DNA free. This minimal DNA content closely mimics the structure and function of the native tissue it is replacing. It signals a bio-normal response by not eliminating but reducing inflammation, and stimulates the body to progress through the phases of natural wound healing. Wounds can be healed with as little as one use, potentially providing patients with faster healing and delivering a quicker recovery.

Tissue Regenix is currently undertaking clinical trials in the EU and will look to introduce dCELL® Technology to orthopedic applications in the U.S. in 2018, initially addressing ACL repair. They will be attending the American Academy of Orthopedic Surgeons (AAOS) annual meeting in March to share more information on this progress with a team of orthopedic and sports medicine experts. Members of Tissue Regenix’s clinical advisory board will attend AAOS, including:

“The application of dCELL® Technology in orthopedics will give surgeons and clinicians an innovative new way to provide care to patients requiring anterior cruciate ligament (ACL) reconstruction, meniscus replacement and other injuries,” said Drew Distin, VP of Orthopedics at Tissue Regenix.

Tissue Regenix will be exhibiting at booth #5750 at the American Academy of Orthopedic Surgeons meeting in San Diego, CA March 14-17.

Tissue Regenix was founded in the U.K. in 2006 to develop and commercialize decellularization research from the University of Leeds and listed on the London Stock Exchange in 2010. With U.S. headquarters in San Antonio, TX, the company continues to develop its roster of products using this technology.

For more information about Tissue Regenix, please visit http://www.tissueregenix.com/.

About Tissue Regenix
Tissue Regenix is a leading medical devices company in the field of regenerative medicine. The company’s patented decellularization (‘dCELL®‘) Technology removes DNA and other cellular material from animal and human tissue leaving an acellular tissue scaffold which is not rejected by the patient’s body which can then be used to repair diseased or worn out body parts. The potential applications of this process are diverse and address many critical clinical needs such as vascular disease, heart valve replacement and knee repair.

Contacts

Tissue Regenix
Jeff Stoecker, 617-624-3424
TissueRegenix@racepointglobal.com


gpfz861697-131790571674284-Michael-Morhamus_origin-1-1.jpg

February 24, 2017 OrthoSpineNews

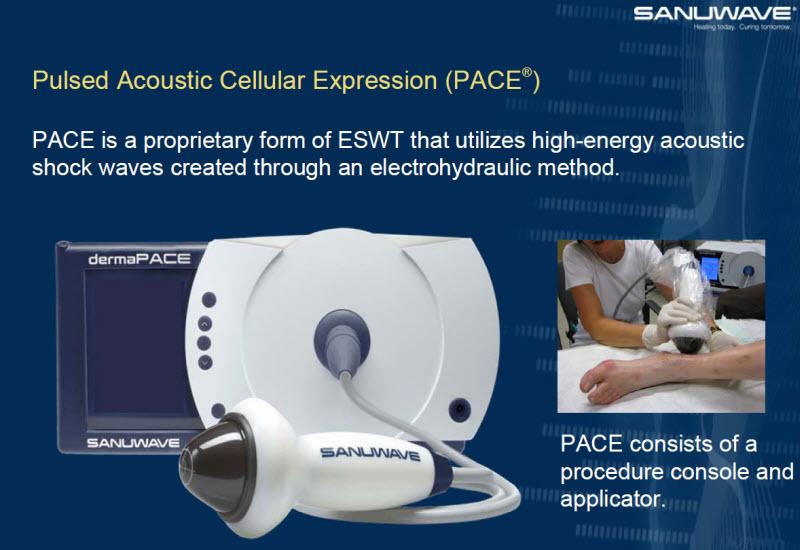
SUWANEE, GA–(Marketwired – Feb 23, 2017) – SANUWAVE Health, Inc. ( OTCQB : SNWV ) announces the launch of the blog, SHOCK THIS on its website www.sanuwave.com. The initial post will be from SANUWAVE’s head of Research and Development, Dr. Iulian Cioanta, titled “What is a shockwave.” The goal of the blog is to allow a medium to help educate customers, patients, partners, and the public about the various initiatives under way at SANUWAVE. The blog will also accept posts and comments (approved by SANUWAVE), which the Company views as valuable to the SANUWAVE community. This is expected to be a constructive forum for users from around the globe. By having a central location, SHOCK THIS, the Company can bring together in one setting various information that will be useful and entertaining to the SANUWAVE community. The initial blog is meant to help people understand, what is a shock wave. Many misconceptions exist about the technology, what it is and what it isn’t, so the plan is to help expand people’s understanding by educating in a fun manner. Members of the SANUWAVE community are encouraged to interact and reach out with thoughts and ideas, which will positively impact the SANUWAVE community as a whole. SANUWAVE Health, Inc. reserves the right to edit or exclude comments it deems not positively impacting the experience or is not appropriate from legal and regulatory perspectives. Kevin Richardson, SANUWAVE’s Acting CEO, said, “This is an exciting launch for us as SANUWAVE begins the process of educating the market on the Company’s technology and devices’ capabilities. In the hopes of receiving FDA approval in the future, this is a first step in building SANUWAVE brand awareness.”

About SANUWAVE Health, Inc.
SANUWAVE Health, Inc. (www.sanuwave.com) is a shock wave technology company initially focused on the development and commercialization of patented noninvasive, biological response activating devices for the repair and regeneration of skin, musculoskeletal tissue and vascular structures. SANUWAVE’s portfolio of regenerative medicine products and product candidates activate biologic signaling and angiogenic responses, producing new vascularization and microcirculatory improvement, which helps restore the body’s normal healing processes and regeneration. SANUWAVE applies its patented PACE technology in wound healing, orthopedic/spine, plastic/cosmetic and cardiac conditions. Its lead product candidate for the global wound care market, dermaPACE®, is CE Marked throughout Europe and has device license approval for the treatment of the skin and subcutaneous soft tissue in Canada, Australia and New Zealand. In the U.S., dermaPACE is currently under the FDA’s Premarket Approval (PMA) review process for the treatment of diabetic foot ulcers. SANUWAVE researches, designs, manufactures, markets and services its products worldwide, and believes it has demonstrated that its technology is safe and effective in stimulating healing in chronic conditions of the foot (plantar fasciitis) and the elbow (lateral epicondylitis) through its U.S. Class III PMA approved OssaTron® device, as well as stimulating bone and chronic tendonitis regeneration in the musculoskeletal environment through the utilization of its OssaTron, Evotron® and orthoPACE® devices in Europe, Asia and Asia/Pacific. In addition, there are license/partnership opportunities for SANUWAVE’s shock wave technology for non-medical uses, including energy, water, food and industrial markets.

Forward-Looking Statements
This press release may contain “forward-looking statements” within the meaning of the Private Securities Litigation Reform Act of 1995, such as statements relating to financial results and plans for future business development activities, and are thus prospective. Forward-looking statements include all statements that are not statements of historical fact regarding intent, belief or current expectations of the Company, its directors or its officers. Investors are cautioned that any such forward-looking statements are not guarantees of future performance and involve risks and uncertainties, many of which are beyond the Company’s ability to control. Actual results may differ materially from those projected in the forward-looking statements. Among the key risks, assumptions and factors that may affect operating results, performance and financial condition are risks associated with the regulatory approval and marketing of the Company’s product candidates and products, unproven pre-clinical and clinical development activities, regulatory oversight, the Company’s ability to manage its capital resource issues, competition, and the other factors discussed in detail in the Company’s periodic filings with the Securities and Exchange Commission. The Company undertakes no obligation to update any forward-looking statement.

For additional information about the Company, visit www.sanuwave.com.


wright-medical-headquarters-memphis-750xx4608-2592-0-432-1.jpg

February 23, 2017 OrthoSpineNews

AMSTERDAM, The Netherlands, Feb. 21, 2017 (GLOBE NEWSWIRE) — Wright Medical Group N.V. (NASDAQ:WMGI) today reported financial results for its fourth quarter and full-year ended December 25, 2016 and provided 2017 guidance.

As a result of the previously announced sale of the large joints (hip/knee) business to Corin Orthopaedics Holdings Limited (Corin), this business which was previously reported as a separate reporting segment is now reported as discontinued operations. In addition, as a result of the merger between Wright Medical Group, Inc. and Tornier N.V. on October 1, 2015, legacy Wright’s historical results of operations replaced legacy Tornier’s historical results of operations for all periods prior to the merger and the results of the two legacy businesses have been consolidated only from that date forward in accordance with United States generally accepted accounting principles (GAAP). This release and Wright’s website at ir.wright.com contain certain unaudited non-GAAP combined pro forma financial results for Wright Medical Group N.V. which give effect to the merger as if it had occurred on the first day of fiscal 2015. In addition, following the closing of the merger, Wright adopted legacy Tornier’s fiscal calendar, which resulted in four fewer calendar days for the fourth quarter of 2015 than under the legacy Wright fiscal calendar.  Additionally, the Wright business conformed its methodology for recognizing revenue to legacy Tornier’s methodology. The attached financial tables include a reconciliation of U.S. GAAP to these non-GAAP financial measures.

Net sales from continuing operations totaled $193.0 million during the fourth quarter ended December 25, 2016, representing 16% as reported growth.  On a same sales day and constant currency basis and excluding the impact of conforming Wright’s methodology for recognizing revenue in the fourth quarter of 2015, non-GAAP pro-forma global net sales grew 12%.  Gross margins from continuing operations were 73.8% during the quarter ended December 25, 2016 and were 77.6% on a non-GAAP adjusted basis.  Reconciliations of all historical non-GAAP financial measures used in this release to the most comparable GAAP measures can be found in the attached financial tables.

Robert Palmisano, president and chief executive officer, commented, “We had a very good fourth quarter, and our full-year results reflect the continued strong underlying growth and positive momentum in all three of our high-growth businesses and our leadership positions in these markets.  Our pro forma constant currency global sales growth of 12%, despite an estimated 3% headwind from dis-synergies, was an acceleration from the third quarter of 2016, and combined with earlier than anticipated progress on capturing cost synergies, resulted in net sales and positive adjusted EBITDA results that exceeded our expectations.  We drove significant overperformance on the top and bottom line in 2016, and we believe we are well positioned to continue driving high sales growth rates and EBITDA margin expansion.”

Palmisano continued, “Highlights in the quarter included strong contributions from our SIMPLICITI shoulder system and the ongoing rollout of AUGMENT and the INFINITY total ankle replacement system, which for the fourth quarter drove 14% sales growth in U.S. shoulder replacement, 29% sales growth in U.S. biologics and 23% sales growth in U.S. total ankle replacement.”

Palmisano further commented, “Our 2017 guidance assumes continued strong underlying constant currency growth, driven by successfully executing our SIMPLICITI and AUGMENT new product launches, launching the PERFORM Reverse Shoulder and expanding the U.S. sales force in order to realize our full potential.  We believe that the positive progress we saw in the fourth quarter is setting us up well for continued strong revenue growth and significant margin expansion in 2017 and beyond.”

Net loss from continuing operations for the fourth quarter of 2016 totaled $30.0 million, or $(0.29) per diluted share.

The company’s net loss from continuing operations for the fourth quarter of 2016 included the after-tax effects of $6.8 million of inventory step-up amortization, $8.4 million of transaction and transition costs, a gain of $1.8 million related to mark-to-market adjustments on derivatives, $10.8 million of non-cash interest expense related to its convertible notes, and a $0.3 million unrealized gain related to mark-to-market adjustments on contingent value rights (CVRs) issued in connection with the BioMimetic acquisition, as well as a $5.6 million tax benefit representing the deferred tax effects associated with the acquired Tornier operations.

The company’s fourth quarter 2016 non-GAAP net loss from continuing operations, as adjusted for the above items, was $13.8 million.  The company’s fourth quarter 2016 non-GAAP adjusted EBITDA from continuing operations, as defined in the non-GAAP to GAAP reconciliation provided later in this release, was $22.7 million. The attached financial tables include reconciliations of all historical non-GAAP measures to the most comparable GAAP measures.

Cash, cash equivalents and restricted cash totaled $412.3 million as of the end of the fourth quarter of 2016.  This amount includes $150 million classified as restricted cash on the company’s balance sheet that is held in escrow to fund a portion of the metal-on-metal hip litigation Master Settlement Agreement (MSA).  The company currently estimates the opt-in rate for the MSA to be in excess of 98%, which is well above the 95% requirement.

Palmisano concluded, “With the significant progress made in 2016, we are a stronger business that is now well positioned and completely focused on the high-growth extremities and biologics markets.  While I am very pleased with what we accomplished in 2016, we are nowhere close to meeting our full potential, and we continue to have great opportunities for revenue growth and cash improvement.  I believe we are positioned well for future success and achieving our key financial goals of mid-teens constant currency net sales growth, gross margins in the high 70% range and non-GAAP adjusted EBITDA margins of approximately 20% three to four years post the close of the merger.”

Outlook

The company anticipates net sales for full-year 2017 of approximately $755 million to $765 million, representing an as reported growth rate of 9% to 11%.  This range assumes:

  • a negative impact from foreign currency exchange rates as compared to 2016 of approximately 2%;
  • $10 million of net sales dis-synergies resulting from customers lost over the course of 2016 due to the sales force integrations;
  • approximately $3 million of dis-synergies from the anticipated divestiture of the international Salto ankle business; and
  • a positive impact of approximately 1% due to four extra selling days in the fourth quarter of 2017.

The midpoint of this net sales guidance range assumes constant currency growth of approximately 13%, excluding the negative impacts of revenue dis-synergies and Salto divestiture of 2%, and the approximately 1% positive impact of the extra selling days.  Additionally, the company anticipates the second half of the year to grow faster than the first half of the year as it realizes the benefits from its new product launches and sales force expansion.

The company anticipates full-year 2017 non-GAAP adjusted EBITDA from continuing operations, as described in the non-GAAP reconciliation provided later in this release, of $78.5 million to $85.5 million.

The company anticipates non-GAAP adjusted earnings per share from continuing operations, including share-based compensation, as described in the non-GAAP to GAAP reconciliation provided later in this release, for full-year 2017 of $(0.33) to $(0.26) per diluted share.

The company estimates approximately 104.5 million diluted weighted average ordinary shares outstanding for fiscal year 2017.

The company’s non-GAAP adjusted EBITDA from continuing operations target is measured by adding back to net loss from continuing operations charges for interest, income taxes, depreciation and amortization expenses, non-cash share-based compensation expense and non-operating income and expense.  Additionally, the company’s adjusted EBITDA from continuing operations target excludes possible future acquisitions; other material future business developments; and due diligence, transaction and transition costs associated with acquisitions and divestitures.  Further, this adjusted EBITDA from continuing operations target excludes any expenses, earnings or losses related to the divested large joints business, legacy Wright’s divested OrthoRecon business and legacy Tornier’s divested ankle replacement and silastic toe products.

The company’s non-GAAP adjusted earnings per share from continuing operations target is measured by adding back to net loss from continuing operations non-cash interest expense associated with the 2017, 2020 and 2021 convertible notes; due diligence, transaction and transition costs associated with acquisitions and divestitures; mark-to-market adjustments to CVRs; non-cash mark-to-market derivative adjustments; and charges for non-cash amortization expenses, net of taxes. Note that as a result of the company’s relatively low effective tax rate due to the valuation allowance impacting a substantial portion of the company’s income/loss, the company is currently estimating the tax effect on amortization expense at 0%. Further, this adjusted earnings per share from continuing operations target excludes possible future acquisitions; other material future business developments; and any expenses, earnings or losses related to the large joints business.

All of the historical non-GAAP financial measures used in this release are reconciled to the most directly comparable GAAP measures. With respect to the company’s 2017 financial guidance regarding non-GAAP adjusted EBITDA from continuing operations and non-GAAP adjusted earnings per share from continuing operations, however, the company cannot provide a quantitative reconciliation to the most directly comparable GAAP measures without unreasonable effort due to its inability to make accurate projections and estimates related to certain information needed to calculate some of the adjustments as described above, including the market driven fair value adjustments to CVRs and derivatives. The anticipated differences between these non-GAAP financial measures and the most directly comparable GAAP measure are described above qualitatively.

The company’s anticipated ranges for net sales from continuing operations, non-GAAP adjusted EBITDA from continuing operations, and non-GAAP adjusted earnings per share from continuing operations are forward-looking statements, as are any other statements that anticipate or aspire to future events or performance.  They are subject to various risks and uncertainties that could cause the company’s actual results to differ materially from the anticipated targets.  The anticipated targets are not predictions of the company’s actual performance.  See the cautionary information about forward-looking statements in the “Cautionary Note Regarding Forward-Looking Statements” section of this release.

Supplemental Financial Information

To view the fourth quarter of 2016 supplemental financial information, visit ir.wright.com.  For updated information on Wright Medical Group N.V. segment reporting changes and non-GAAP combined pro forma historical financial information, including fourth quarter of 2016, please refer to the presentation posted on Wright’s website at ir.wright.com in the “Financial Information” section.

Internet Posting of Information

Wright routinely posts information that may be important to investors in the “Investor Relations” section of its website at www.wright.com.  The company encourages investors and potential investors to consult the Wright website regularly for important information about Wright.

Conference Call and Webcast

As previously announced, Wright will host a conference call starting at 3:30 p.m. Central Time today.  The live dial-in number for the call is (844) 295-9436 (U.S.) / (574) 990-1040 (Outside U.S.).  The participant passcode for the call is “Wright.”  A simultaneous webcast of the call will be available via Wright’s corporate website at www.wright.com.

A replay of the call will be available beginning at 5:30 p.m. Central Time on February 21, 2017 through February 28, 2017.  To hear this replay, dial (855) 859-2056 (U.S.) / (404) 537-3406 (Outside U.S.) and enter code 43718210.  A replay of the conference call will also be available via the internet starting today and continuing for at least 12 months.  To access a replay of the conference call via the internet, go to the Investor Relations -Presentations/Calendar” section of the company’s corporate website located at www.wright.com.

The conference call may include a discussion of non-GAAP financial measures.  Reference is made to the most directly comparable GAAP financial measures, the reconciliation of the differences between the two financial measures, and the other information included in this release, the Current Report on Form 8-K filed with the U.S. Securities and Exchange Commission (SEC) today, or otherwise available in the “Investor Relations – Supplemental Financial Information” section of the company’s corporate website located at www.wright.com.

The conference call may include forward-looking statements.  See the cautionary information about forward-looking statements in the “Cautionary Note Regarding Forward-Looking Statements” section of this release.

About Wright Medical Group N.V.

Wright Medical Group N.V. is a global medical device company focused on extremities and biologics products. The company is committed to delivering innovative, value-added solutions improving quality of life for patients worldwide and is a recognized leader of surgical solutions for the upper extremities (shoulder, elbow, wrist and hand), lower extremities (foot and ankle) and biologics markets, three of the fastest growing segments in orthopaedics.  For more information about Wright, visit www.wright.com.

™ and ® denote trademarks and registered trademarks of Wright Medical Group N.V. or its affiliates,  registered as indicated in the United States, and in other countries.  All other trademarks and trade names referred to in this release are the property of their respective owners.

Non-GAAP Financial Measures  

To supplement the company’s consolidated financial statements prepared in accordance with U.S. generally accepted accounting principles, the company uses certain non-GAAP financial measures in this release. Reconciliations of the historical non-GAAP financial measures used in this release to the most comparable GAAP measures for the respective periods can be found in tables later in this release. Wright’s non-GAAP financial measures include combined pro forma net sales; combined pro forma net sales, excluding the impact of foreign currency; adjusted average sales per day (ASPD); adjusted combined pro forma ASPD; net income, as adjusted; EBITDA, as adjusted; gross margin, as adjusted; earnings, as adjusted; and earnings, as adjusted, per diluted share, in each case, from continuing operations. The company’s management believes that the presentation of these measures provides useful information to investors.  These measures may assist investors in evaluating the company’s operations, period over period. While pro forma data gives effect to the merger with Tornier as if it had occurred on the first day of fiscal 2015 and enhances comparability of financial information between periods, pro forma data is not indicative of the results that actually would have been obtained if the merger had occurred as of the beginning of 2015. Wright’s non-GAAP financial measures exclude such items as non-cash interest expense related to the company’s 2017 convertible notes, 2020 convertible notes and 2021 convertible notes, net gains and losses on mark-to-market adjustments on and settlements of derivative assets and liabilities, write-off of unamortized debt discount and deferred financing charges following the partial settlement of 2017 convertible notes and 2020 convertible notes, mark-to-market adjustments on CVRs, and transaction and transition costs, all of which may be highly variable, difficult to predict and of a size that could have substantial impact on the company’s reported results of operations for a period.  It is for this reason that the company cannot provide without unreasonable effort a quantitative reconciliation to the most directly comparable GAAP measures for its 2017 financial guidance regarding non-GAAP adjusted EBITDA from continuing operations and non-GAAP adjusted earnings per share from continuing operations. Management uses the non-GAAP measures in this release internally for evaluation of the performance of the business, including the allocation of resources and the evaluation of results relative to employee performance compensation targets.  Investors should consider non-GAAP financial measures only as a supplement to, not as a substitute for or as superior to, measures of financial performance prepared in accordance with GAAP.

CAUTIONARY NOTE REGARDING FORWARD-LOOKING STATEMENTS 

This release includes forward-looking statements under the Private Securities Litigation Reform Act of 1995. These forward-looking statements generally can be identified by the use of words such as “anticipate,” “expect,” “intend,” “could,” “may,” “will,” “believe,” “estimate,” “look forward,” “forecast,” “goal,” “target,” “project,” “continue,” “outlook,” “guidance,” “future,” other words of similar meaning and the use of future dates. Forward-looking statements in this release include, but are not limited to, statements about the company’s anticipated financial results for 2017, including net sales from continuing operations, adjusted EBITDA from continuing operations and adjusted earnings per share from continuing operations; anticipated sales and cost synergies and dis-synergies and the timing thereof; the company’s expectations regarding the benefits of its merger with Tornier and integration efforts and progress; and the company’s ability to achieve its key financial goals. Forward-looking statements by their nature address matters that are, to different degrees, uncertain. Each forward-looking statement contained in this release is subject to risks and uncertainties that could cause actual results to differ materially from those expressed or implied by such statement. Applicable risks and uncertainties include, among others, the failure to integrate the businesses and realize net sales synergies and cost savings from the merger with Tornier or delay in realization thereof; operating costs and business disruption as a result of the merger, including adverse effects on employee retention and sales force productivity and on business relationships with third parties; integration costs; actual or contingent liabilities; adverse effects of diverting resources and attention to providing transition services to the purchaser of the large joints business; the adequacy of the company’s capital resources and need for additional financing; the timing of regulatory approvals and introduction of new products; physician acceptance, endorsement, and use of new products; failure to achieve the anticipated benefits from approval of AUGMENT® Bone Graft; the effect of regulatory actions, changes in and adoption of reimbursement rates; product liability claims and product recalls; pending and threatened litigation; risks associated with the metal-on-metal master settlement agreement and the settlement agreement with the three settling insurers; risks associated with international operations and expansion; fluctuations in foreign currency exchange rates; other business effects, including the effects of industry, economic or political conditions outside of the company’s control; reliance on independent distributors and sales agencies; competitor activities; changes in tax and other legislation; and the risks identified under the heading “Risk Factors” in Wright’s Annual Report on Form 10-K for the year ended December 25, 2016 anticipated to be filed by Wright with the SEC by February 23, 2017. Investors should not place considerable reliance on the forward-looking statements contained in this release. Investors are encouraged to read Wright’s filings with the SEC, available at www.sec.gov, for a discussion of these and other risks and uncertainties. The forward-looking statements in this release speak only as of the date of this release, and Wright undertakes no obligation to update or revise any of these statements. Wright’s business is subject to substantial risks and uncertainties, including those referenced above. Investors, potential investors, and others should give careful consideration to these risks and uncertainties.

–Tables Follow–

Wright Medical Group N.V.
Condensed Consolidated Statements of Operations
 (in thousands, except per share data–unaudited)
Three months ended Fiscal year ended
December 25,
2016
December 27,
2015
December 25,
2016
December 27,
2015
Net sales 1 $ 193,023 $ 166,833 $ 690,362 $ 405,326
Cost of sales 1 50,583 49,810 192,407 113,622
Gross profit 1 142,440 117,023 497,955 291,704
Operating expenses:
Selling, general and administrative 1 140,489 173,576 541,558 424,377
Research and development 1 13,809 14,695 50,514 39,339
Amortization of intangible assets 1 7,434 9,013 28,841 16,754
Total operating expenses 1 161,732 197,284 620,913 480,470
Operating loss 1 (19,292 ) (80,261 ) (122,958 ) (188,766 )
Interest expense, net 16,857 11,565 58,530 41,358
Other expense (income), net 346 3,489 (3,148 ) 10,884
Loss from continuing operations before income taxes 1 (36,495 ) (95,315 ) (178,340 ) (241,008 )
Provision (benefit) for income taxes (6,493 ) (4,163 ) (13,406 ) (3,652 )
Net loss from continuing operations 1 $ (30,002 ) $ (91,152 ) $ (164,934 ) $ (237,356 )
Loss from discontinued operations, net of tax 1 (14,874 ) $ (14,624 ) $ (267,439 ) $ (61,345 )
Net loss 1 $ (44,876 ) $ (105,776 ) $ (432,373 ) $ (298,701 )
Net loss from continuing operations per share, basic 2 $ (0.29 ) $ (0.89 ) $ (1.60 ) $ (3.66 )
Net loss from continuing operations per share, diluted 2 $ (0.29 ) $ (0.89 ) $ (1.60 ) $ (3.66 )
Net loss per share, basic 2 $ (0.43 ) $ (1.03 ) $ (4.20 ) $ (4.61 )
Net loss per share, diluted 2 $ (0.43 ) $ (1.03 ) $ (4.20 ) $ (4.61 )
Weighted-average number of shares outstanding-basic 2 103,309 102,659 102,968 64,808
Weighted-average number of shares outstanding-diluted 2 103,309 102,659 102,968 64,808

_______________________________

The prior year balances were revised to reflect the historical results of the company’s Large Joints business within Loss from discontinued operations, net of tax.

2 The prior year weighted-average shares outstanding and net loss per share amounts were converted to meet post-merger valuations.

Wright Medical Group N.V.
Consolidated Sales Analysis
(dollars in thousands–unaudited)
Three months ended Fiscal year ended
December 25,
2016
December 27,
2015
%
change
December 25,
2016
December 27,
2015
%
change
U.S.
Lower extremities 64,064 58,819 8.9 % 222,936 187,096 19.2 %
Upper extremities 55,462 47,053 17.9 % 201,579 58,756 243.1 %
Biologics 21,436 15,971 34.2 % 74,603 50,583 47.5 %
Sports med & other 2,103 1,830 14.9 % 8,429 3,388 148.8 %
Total U.S. $ 143,065 $ 123,673 15.7 % $ 507,547 $ 299,823 69.3 %
International
Lower extremities 16,717 15,887 5.2 % 62,701 51,200 22.5 %
Upper extremities 24,261 19,066 27.2 % 86,502 24,789 249.0 %
Biologics 5,079 4,582 10.8 % 18,883 19,652 (3.9 )%
Sports med & other 3,901 3,625 7.6 % 14,729 9,862 49.4 %
Total International $ 49,958 $ 43,160 15.8 % $ 182,815 $ 105,503 73.3 %
Global
Lower extremities 80,781 74,706 8.1 % 285,637 238,296 19.9 %
Upper extremities 79,723 66,119 20.6 % 288,081 83,545 244.8 %
Biologics 26,515 20,553 29.0 % 93,486 70,235 33.1 %
Sports med & other 6,004 5,455 10.1 % 23,158 13,250 74.8 %
Total sales $ 193,023 $ 166,833 15.7 % $ 690,362 $ 405,326 70.3 %
Wright Medical Group N.V.
Reconciliation of Non-GAAP Combined Pro Forma Net Sales to Net Sales
(dollars in thousands–unaudited)
Three months ended
December 27, 2015
Net Sales
As Reported
Legacy Tornier
Stub Period
(September 28,
2015 –
September 30,
2015) 1
Legacy Tornier
Net Sales

Divested 2
Non-GAAP
combined pro
forma
net sales
U.S.
Lower extremities $ 58,819 $ 279 $ $ 59,098
Upper extremities 47,053 1,773 48,826
Biologics 15,971 66 16,037
Sports med & other 1,830 4 1,834
Total extremities & biologics 123,673 2,122 125,795
Large joint
Total U.S. $ 123,673 $ 2,122 $ $ 125,795
International
Lower extremities $ 15,887 $ 152 $ $ 16,039
Upper extremities 19,066 1,260 20,326
Biologics 4,582 13 4,595
Sports med & other 3,625 132 3,757
Total extremities & biologics 43,160 1,557 44,717
Large joint 753 (753 )
Total International $ 43,160 $ 2,310 $ (753 ) $ 44,717
Global
Lower extremities $ 74,706 $ 431 $ $ 75,137
Upper extremities 66,119 3,033 69,152
Biologics 20,553 79 20,632
Sports med & other 5,455 136 5,591
Total extremities & biologics 166,833 3,679 170,512
Large joint 753 (753 )
Total net sales $ 166,833 $ 4,432 $ (753 ) $ 170,512

_______________________________

To add revenues from Legacy Tornier’s fourth quarter for the period prior to the merger closing date when operations became consolidated.

To reduce from Tornier’s historical sales the global sales associated with Tornier’s Large Joints business that have been reflected in discontinued operations.

Wright Medical Group N.V.
Reconciliation of Non-GAAP Combined Pro Forma Net Sales to Net Sales
(dollars in thousands–unaudited)
Fiscal year ended
December 27, 2015
Net Sales
As Reported
Legacy Tornier
N.V. standalone
nine months
ended
September 27,
2015 1
Legacy Tornier
stub period
(September 28,
2015 –
September 30,
2015) 2
Legacy Tornier
Net Sales
Divested 3
Non-GAAP
Combined

Pro Forma
Net Sales
U.S.
Lower extremities 187,096 29,637 279 (9,733 ) 207,279
Upper extremities 58,756 115,846 1,773 176,375
Biologics 50,583 1,290 66 51,939
Sports med & other 3,388 5,021 4 8,413
Total extremities & biologics 299,823 151,794 2,122 (9,733 ) 444,006
Large joint 119 (119 )
Total U.S. $ 299,823 $ 151,913 $ 2,122 $ (9,852 ) $ 444,006
International
Lower extremities 51,200 7,402 152 58,754
Upper extremities 24,789 51,293 1,260 77,342
Biologics 19,652 357 13 20,022
Sports med & other 9,862 5,372 132 15,366
Total extremities & biologics 105,503 64,424 1,557 171,484
Large joint 29,921 753 (30,674 )
Total International $ 105,503 $ 94,345 $ 2,310 $ (30,674 ) $ 171,484
Global
Lower extremities 238,296 37,039 431 (9,733 ) 266,033
Upper extremities 83,545 167,139 3,033 253,717
Biologics 70,235 1,647 79 71,961
Sports med & other 13,250 10,393 136 23,779
Total extremities & biologics 405,326 216,218 3,679 (9,733 ) 615,490
Large joint 30,040 753 (30,793 )
Total sales $ 405,326 $ 246,258 $ 4,432 $ (40,526 ) $ 615,490

_______________________________

Legacy Tornier product line sales have been recast to reflect the reclassification of cement, instruments and freight from the historical Tornier product line “Large Joints and Other” to the product line associated with those revenues that will be utilized for future revenue reporting.

To add revenues from Legacy Tornier’s fourth quarter for the period prior to the merger closing date when operations became consolidated.

To reduce from Tornier’s historical sales the U.S. sales associated with Tornier’s Salto Talaris and Salto XT ankle replacement products and silastic toe replacement products that were divested prior to the merger and the global sales associated with Tornier’s Large Joints business that have been reflected in discontinued operations.

Wright Medical Group N.V.
Reconciliation of Non-GAAP Adjusted Combined Pro Forma Average Sales per Day to Average Sales per Day
(dollars in thousands–unaudited)
Three months ended
December 25, 2016
U.S. International Global
Net sales $ 143,065 $ 49,958 $ 193,023
Average sales per day (ASPD) $ 2,308 $ 769 $ 3,077
ASPD growth % 8.3 % 10.5 % 8.8 %
Impact of foreign currency exchange rates (FX) 1 1,695 1,695
Non-GAAP net sales, excluding the impact of FX $ 143,065 $ 51,653 $ 194,718
Selling days 62 65
Non-GAAP ASPD, excluding the impact of FX $ 2,308 $ 795 $ 3,103
Non-GAAP pro forma ASPD constant currency growth % 2 11.4 % 12.9 % 11.8 %
Three months ended
December 27, 2015
U.S. International Global
Legacy Wright $ 72,121 $ 21,444 $ 93,565
Legacy Tornier 51,552 21,716 73,268
Net sales, as reported $ 123,673 $ 43,160 $ 166,833
ASPD $ 2,132 $ 696 $ 2,828
Legacy Tornier stub period (September 28, 2015 – September 30, 2015) 3 2,122 1,557 3,679
Non-GAAP pro forma legacy Tornier


$ 53,674 $ 23,273 $ 76,947
Legacy Wright impact of revenue recognition 4 (2,994 ) (2,994 )
Non-GAAP adjusted legacy Wright $ 69,127 $ 21,444 $ 90,571
Legacy Tornier selling days 61 65
Legacy Wright selling days 58 62
Non-GAAP adjusted combined pro forma ASPD 5 $ 2,072 $ 704 $ 2,776

_______________________________

1 The impact of FX on net sales is calculated by translating current year results at prior year average foreign currency exchange rates.

Reflects growth of Q4 2016 Non-GAAP ASPD, excluding the impact of FX, over the Q4 2015 Non-GAAP adjusted combined pro forma ASPD.

To add revenues from Legacy Tornier’s fourth quarter for the period prior to merger closing date when operations became consolidated.

Legacy Wright recognized approximately $3 million during the fourth quarter of 2015, as result of conforming its methodology for revenue recognition with Legacy Tornier.

Legacy Wright and Legacy Tornier have historically operated on different fiscal periods. In order to calculate pro forma sales growth, we have calculated average sales per day based on the respective legacy company and the associated geographic region, then added the legacy company ASPD together.

[Example: Q4 2015 Pro Forma Legacy Tornier U.S. Sales / Legacy Tornier U.S. Selling Days = $880K. Q4 2015 Adjusted Legacy Wright U.S. Sales / Legacy Wright U.S. Selling Days = $1,192K. Adjusted Pro Forma Combined Average Sales per Day = $2,072K]

Wright Medical Group N.V.
Reconciliation of Non-GAAP Adjusted Gross Margins to Gross Margins from Continuing Operations
 (dollars in thousands–unaudited)
Three months ended Fiscal year ended
December 25, 2016 December 25, 2016
Gross profit from continuing operations, as reported $ 142,440 $ 497,955
Gross margins from continuing operations, as reported 73.8 % 72.1 %
Reconciling items impacting gross profit:
Inventory step-up amortization 6,767 37,689
Transaction and transition costs 547 4,198
Non-GAAP gross profit from continuing operations, as adjusted $ 149,754 $ 539,842
Net sales from continuing operations 193,023 690,362
Non-GAAP adjusted gross margins from continuing operations 77.6 % 78.2 %
Wright Medical Group N.V.
Reconciliation of Adjusted Non-GAAP Earnings Per Share to Net Loss from Continuing Operations Per Share
(dollars in thousands, except per share data–unaudited)
Three months ended Fiscal year ended
December 25, 2016 December 25, 2016
Net loss from continuing operations, as reported $ (30,002 ) $ (164,934 )
Net loss from continuing operations per share, as reported (0.29 ) (1.60 )
Reconciling items:
Inventory step-up amortization 6,767 37,689
Non-cash interest expense on convertible notes 10,755 36,567
Non-cash loss on extinguishment of debt 12,343
Derivatives mark-to-market adjustments (1,813 ) (28,273 )
Transaction and transition costs 8,422 36,374
Management changes 1,348
CVR mark-to-market adjustments (280 ) 8,688
Contingent consideration fair value adjustment 93 469
Legal settlement 1,800
Costs associated with new convertible debt 234
IRS settlement 1 (3,073 )
Tax effect of reconciling items 2 (2,114 ) (7,748 )
Deferred tax benefit from acquired operations (5,598 ) (5,598 )
Non-GAAP net loss from continuing operations, as adjusted $ (13,770 ) $ (74,114 )
Add back amortization of intangible assets 7,434 28,841
Adjusted non-GAAP earnings $ (6,336 ) $ (45,273 )
Weighted-average basic shares outstanding 103,309 102,968
Adjusted non-GAAP earnings per share $ (0.06 ) $ (0.44 )

_______________________________

1  IRS settlement includes $0.8 million of interest income and $2.3 million tax benefit.

2  Determined based upon the effective tax rate in the jurisdiction in which the expense was incurred.

Wright Medical Group N.V.
Reconciliation of Non-GAAP Adjusted EBITDA to Net Loss from Continuing Operations
 (dollars in thousands–unaudited)
Three months ended Fiscal year ended
December 25, 2016 December 25, 2016
Net loss from continuing operations $ (30,002 ) $ (164,934 )
Interest expense, net 16,857 58,530
Benefit (provision) from income taxes (6,493 ) (13,406 )
Depreciation 14,825 55,830
Amortization 7,434 28,841
Non-GAAP EBITDA $ 2,621 $ (35,139 )
Reconciling items impacting EBITDA:
Non-cash share-based compensation expense 4,515 14,416
Other expense (income), net 346 (3,148 )
Inventory step-up amortization 6,767 37,689
Transaction and transition costs 8,422 36,374
Management changes 1,348
Legal settlement 1,800
Costs associated with new convertible debt 234
Non-GAAP adjusted EBITDA $ 22,671 $ 53,574
Net sales from continuing operations 193,023 690,362
Non-GAAP adjusted EBITDA margin 11.7 % 7.8 %
Wright Medical Group N.V.
Reconciliation of Other Non-GAAP Financial Measures to Other As Reported Results
 (dollars in thousands–unaudited)
Three months ended Fiscal year ended
December 25, 2016 December 25, 2016
Net sales $ 193,023 $ 690,362
Selling, general and administrative expense, as reported $ 140,489 $ 541,558
Selling, general and administrative expense as a percentages of net sales, as reported 72.8 % 78.4 %
Reconciling items impacting selling, general and administrative expense:
Transaction and transition costs – selling, general and administrative 7,948 31,860
Management changes 1,348
Legal settlement 1,800
Costs associated with new convertible debt 234
Selling, general and administrative expense, as adjusted $ 132,541 $ 506,316
Selling, general and administrative expense as a percentage of net sales, as adjusted 68.7 % 73.3 %
Research & development expense, as reported $ 13,809 $ 50,514
Research & development expense as a percentages of net sales, as reported 7.2 % 7.3 %
Reconciling items impacting research & development expense:
Transaction and transition costs – research & development (73 ) 316
Research & development expense, as adjusted $ 13,882 $ 50,198
Research & development expense as a percentage of net sales, as adjusted 7.2 % 7.3 %
Wright Medical Group N.V.
Condensed Consolidated Balance Sheets
(dollars in thousands–unaudited)
December 25, 2016 December 27, 2015
Assets
Current assets:
Cash and cash equivalents $ 262,265 $ 139,804
Restricted cash 150,000
Accounts receivable, net 130,602 131,050
Inventories 1 150,849 210,701
Prepaid expenses and other current assets 1 65,909 59,842
Current assets held for sale 1 18,487
Total current assets 759,625 559,884
Property, plant and equipment, net 1 201,732 224,256
Goodwill and intangible assets, net 1 1,082,839 1,117,917
Other assets 2 246,390 139,754
Other assets held for sale 1 31,683
Total assets 1, 2 $ 2,290,586 $ 2,073,494
Liabilities and shareholders’ equity
Current liabilities:
Accounts payable $ 32,866 $ 30,904
Accrued expenses and other current liabilities 1 407,704 171,171
Current portion of long-term obligations 33,948 2,171
Current liabilities held for sale 1 2,692
Total current liabilities 474,518 206,938
Long-term obligations 2 780,407 561,201
Other liabilities 348,797 250,329
Total liabilities 1, 2 1,603,722 1,018,468
Shareholders’ equity 686,864 1,055,026
Total liabilities and shareholders’ equity 1, 2 $ 2,290,586 $ 2,073,494

_______________________________

The prior period balances exclude amounts associated with the company’s Large Joints business, as these amounts are classified as held for sale at December 27, 2015.

The prior period debt issuance costs were reclassified to account for adoption of ASU 2015-03 and ASU 2015-15.

Investors & Media:

Julie D. Tracy
Sr. Vice President, Chief Communications Officer
Wright Medical Group N.V.
(901) 290-5817
julie.tracy@wright.com

Primary Logo

Wright Medical Group N.V.


download-1.jpeg

February 23, 2017 OrthoSpineNews

ENGLEWOOD, Colo., Feb. 22, 2017 /PRNewswire/ — Since its inception, Paragon 28 has obsessed over every aspect of foot and ankle surgery. Committed to creating tailored solutions to improve surgical outcomes, Paragon 28 has launched innovative products and instrumentation that help to streamline procedures, allow surgeons flexibility in technique and approach and facilitate reproducible results benefiting both the surgeon and patient.

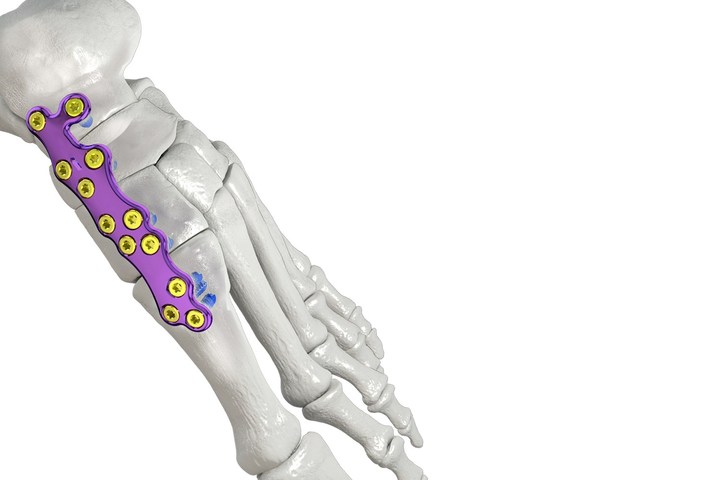
The Gorilla® Medial Column Plating System is the latest example of Paragon 28’s commitment to excellence.  The system offers surgeons 36 unique plating options to address varying patient anatomies and levels of deformity and includes plates of varying thickness (1.5 mm and 2.0 mm) to account for size and severity of condition. The plates are constructed from titanium (Ti6AI4V-ELI) for increased strength.  All of the plates accept 2.7, 3.5, and 4.2 mm locking and non-locking polyaxial screws allowing the surgeon to target the highest quality bone around the fracture site.  All plates accept both R3CON™ and TuffNeck screw technologies allowing surgeons flexibility to vary the stoutness of the construct to best meet the needs of the patient. Additionally, all holes have a built-in recess to reduce screw head prominence.

Additional Plate Features:

  • Superior holes on the Arch and Proximal Arch plates are tabbed allowing the surgeon to bend the plate to better contour to the talus.
  • Fixed axis screw trajectories are intended to capture the highest quality bone on either side of each fusion site without intersecting.

As is customary with all Paragon 28 systems, this system includes procedure specific instrumentation to facilitate dissection and accurate plate placement.

  • Pin Distractor
    • Allows for greater exposure to joint spaces to aid in removal of osteophytes and cartilage
  • Compression-Distraction Device
    • Attaches on either side of the plate or bone fusion site using two k-wires to create in-line compression or distraction
  • Subchondral Drill
    • For use in arthrodesis joint preparation, the instrument provides approximately 10 mm of controlled drilling of subchondral bone with a stop to help prevent deeper penetration
  • Cartilage Removal Tool
    • Provides “reverse cutting” functionality which is ideal for debridement of curved, small and/or difficult to access joints

Paragon 28 is grateful for the significant contribution Dr. Chris Coetzee, MD made in the design of plates included in this system.

Product Page:
http://www.paragon28.com/products/medial-column-plating-system/

CONTACT:
Jim Edson
jedson@paragon28.com


SOURCE Paragon 28, Inc.

Related Links

http://www.paragon28.com


hqdefault-1.jpg

February 23, 2017 OrthoSpineNews

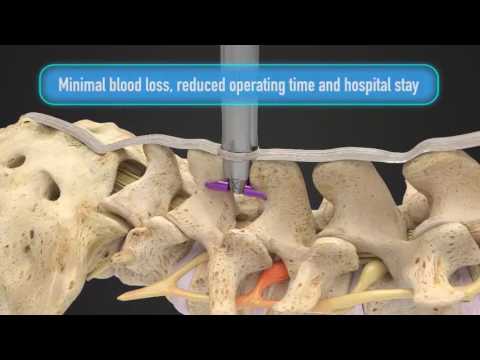
Pain management doctor, Andrew Cottingham, MD of OPTIMAL Pain & Regenerative Medicine is the first physician in North Texas to implant the new Vertiflex Superion Indirect Decompression System®. The Vertiflex Superion is a minimally invasive, safe, out-patient procedure that gives patients an alternative to spine surgery for the treatment of lumbar spinal stenosis.

Back and leg pain affects millions of Americans every year. Lumbar spinal stenosis is caused by aging and “wear” on the discs between the vertebrae. The degeneration of the discs causes the spinal canal to narrow, which leads to additional pressure on the nerves in the lower back. This pressure leads to lower back pain and radiating leg, buttock and/or groin pain. Symptoms typically intensify during standing and walking and decrease when sitting and bending forward.

Conservative treatment of lumbar spinal stenosis typically involves rest, physical therapy, medication management and epidural steroid injections. When non-surgical treatment does not alleviate symptoms, surgical treatment historically involves direct compression surgery. The Vertiflex Superion device is an FDA approved minimally invasive treatment option for patients suffering from lower back pain and radiating leg pain caused by lumbar spinal stenosis.

The procedure uses a Superion implant, which is a small titanium device that is inserted through a small incision in the lower back. The implant is then placed in the spinal structure to keep the spine positioned such that the nerves in the spinal canal are not compressed. The device has been implanted in more than 2,000 patients worldwide. The clinical trial results showed a decrease in pain. Four years post-procedure, almost 90% of the clinical trial patients expressed continuing satisfactory results.

“The Vertiflex Superion is an elegant, minimally invasive procedure that can change so many people’s lives who are suffering from lower back pain and radiating leg pain caused by lumbar spinal stenosis,” said Dr. Andrew Cottingham.

To learn if you are a candidate, please call us at 817-468-4343 or visit our website: The Vertiflex Superion Procedure.

About OPTIMAL Pain & Regenerative Medicine

The pain management doctors at OPTIMAL, Drs. Cottingham, Berlin and Phillips, are dedicated to staying on the forefront of pain management and regenerative medicine procedures. Each physician is double-board certified in anesthesiology and pain medicine. Through their collective expertise, the OPTIMAL team delivers comprehensive, current and compassionate medical care to patients in Dallas, Fort Worth and Arlington, Texas.


Bioness-StimRouter.jpg

February 23, 2017 OrthoSpineNews

VALENCIA, Calif., Feb. 22, 2017 /PRNewswire/ — Bioness, Inc., the leading provider of cutting edge, clinically supported rehabilitation therapies, today announced the first series of successful StimRouter Neuromodulation System implantations in Europe at Radboud University Medical Center (Nijmegen, Netherlands), South Victoria University (Cork, Ireland), and Kliniek Park Leopold Chirec (Brussels, Belgium). With the successful launch continuing, Bioness plans to further support clinicians across the continent who are looking to support patients seeking minimally-invasive, long-term pain relief.

Erkan Kurt, MD (The Netherlands), Dominic Hegarty, MD (Ireland), and Jean Pierre van Buyten, MD (Belgium) implanted the StimRouter to manage chronic pain conditions originating from varied peripheral neuralgias. With an estimated 100 million Europeans suffering from chronic pain, there has never been a greater need for innovative pain management options.

“For many years we have had limited solutions to help our patients manage their debilitating pain,” shared Dominic Hegarty, MD, a trained Interventional Neuromodulation and Pain Management Specialist. “I’m very pleased to be able to provide the best neuromodulation options for my patients. I am confident that the StimRouter technology will be suitable for a greater range of patients in the future.”

“The StimRouter promises to be a breakthrough in neurostimulation because it is a much smaller device to implant and therefore easier to target pain at its origin,” stated Jean Pierre van Buyten, MD, an internationally renowned Pain Anesthesiologist. “Another advantage is that it minimizes cost and recovery time when compared to other more invasive treatments.”

“Peripheral neuropathy is a very common and often painful disorder. As a neurosurgeon with more than 20 years of neuromodulation experience, the StimRouter provides a unique opportunity to deliver patients relief from chronic pain, especially among those with peripheral nerve damage and scar tissue around the targeted nerve,” explained Erkan Kurt, MD. “Where percutaneous implantation might be a difficult procedure, the StimRouter is a small device that takes a minimally invasive approach that is easy to perform. Another great advantage is the transdermal electrical stimulation which makes implantation of an implantable pulse generator unnecessary.”

As a minimally invasive device designed to reduce pain by specifically targeting the affected peripheral nerve, the StimRouter is intended to be a cost-effective and long-term alternative to immobilization, injections, and prescription opioids. The implant procedure is usually completed in less than 30 minutes and uses only local anesthesia.

“As we continue to see impressive clinical results in the US and now Europe we are excited to further our mission of supporting clinicians looking to improve the lives of patients,” said Todd Cushman, President and CEO of Bioness. “Patients and their loved ones are looking for true relief from the downward spiral of chronic pain. With greater awareness of opioid addiction, alternative choices which deliver life improving results are needed. We are thrilled to be bringing expanded treatment options to those who care for patients.”

StimRouter was the first FDA cleared minimally-invasive, long-term, minimally invasive neuromodulation medical device indicated to treat chronic pain of a peripheral nerve origin. The StimRouter System then received CE mark in February of 2014 and the Company began expanding its focus into the European Union. The patient controlled medical device is an adjunct to other modes of therapy and is being well received by patients and clinicians alike.

The StimRouter is currently being implanted at prestigious clinical institutions across the United States to treat chronic peripheral nerve pain, with specific focus on the following conditions or areas:

  • Axillary nerve (e.g. post-stroke shoulder pain)
  • Ulnar nerve (e.g. cubital tunnel syndrome)
  • Suprascapular
  • Superior Cluneal nerve (e.g. lower back neuralgia)
  • Genicular nerve
  • Median nerve
  • Peroneal nerves

For more information on the StimRouter as well as videos of real patients sharing their StimRouter experience, please visit www.stimrouter.com.

About StimRouterNeuromodulation System

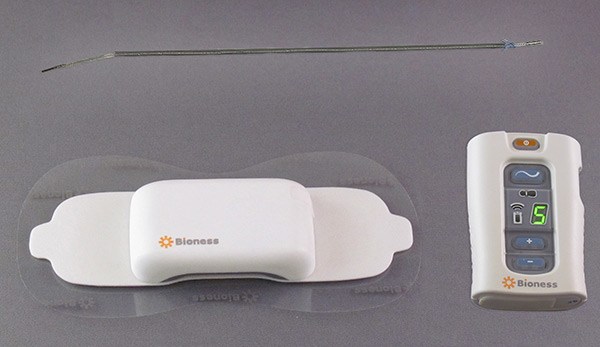
StimRouter is cleared by the FDA to treat chronic pain of peripheral nerve origin. StimRouter is a minimally invasive neuromodulation medical device consisting of a thin, implanted lead with conductive electrode, external pulse transmitter (EPT), and hand-held wireless patient programmer. Electrical signals are transmitted transdermally from the EPT through the electrode, down the lead to the target nerve. StimRouter is programmed at the direction of the physician to meet patient requirements but is controlled by the patient to address the patients specific, changing pain management needs.

About Bioness, Inc.

Bioness is the leading provider of innovative technologies helping people regain mobility and independence. Bioness solutions include implantable and external neuromodulation systems, robotic systems and software based therapy programs providing functional and therapeutic benefits for individuals affected by pain, central nervous system disorders and orthopedic injuries. Currently, Bioness offers six medical devices within its commercial portfolio which are distributed and sold on five continents and in over 25 countries worldwide. Bioness innovations have been implemented in the most prestigious and well-respected institutions around the globe with 17 of the top 20 rehabilitation hospitals in the United States currently using one or more Bioness solution. Bioness has a singular focus on aiding large, underserved customer groups with innovative, evidence-based solutions and we will continue to develop and make commercially available new products that address the growing and changing needs of our customers. Individual results vary. Consult with a qualified physician to determine if this product is right for you. Contraindications, adverse reactions and precautions are available online at www.bioness.com.

Media Relations Contact Information
Next Step Communications
bioness@nextstepcomms.com
781.326.1741

StimRouter™ and Bioness® are trademarks of Bioness, Inc. | www.bioness.com | Rx Only | Additional information about StimRouter can be found at www.stimrouter.com

SOURCE Bioness, Inc.

Related Links

http://www.bioness.com


Corin_The-Corinium-Centre-in-Love-Lane.jpg

February 23, 2017 OrthoSpineNews

TAMPA, Fla., Feb. 22, 2017 /PRNewswire/ — Corin Group announced today the launch of the Humelock Reversed Shoulder System, a device used to treat patients with both a massive rotator cuff tear and a severe form of shoulder arthritis. The condition, known as cuff tear arthropathy, causes pain and reduced mobility in the arm and shoulder.

The Humelock Reversed Shoulder System, which was developed by FX Solutions, a privately-held upper extremities technology company based near Lyon, France, received FDA clearance for the device in January 2017. The device is already available in Europe and other international markets.

Corin Group holds a distribution agreement for the device, as well as the Humelock II™ Cementless and Cemented Anatomical and Reversible Fracture Shoulder Systems. The agreement includes distribution rights in the United States, Germany and the United Kingdom.

“Our partnership with FX Solutions allows Corin to increase their offering in shoulder arthroplasty, whilst we continue to expand solutions in hip and knee. Our goal is to provide surgeons, hospitals, health systems, and patients with a new and comprehensive approach to orthopaedics and joint replacement,” said Paul Berman, President, Corin USA. “The launch of the Humelock Reversed Shoulder System means patients in the U.S. will have access to an important new option for reverse shoulder replacement.”

“Our continuing partnership with Corin provides U.S. clinicians access to our surgeon-designed shoulder systems, which have demonstrated clinical success in European markets,” said FX Solutions’ President and CEO Jean-Jacques Martin. “Corin is a valued partner committed to innovation that improves health outcomes and increases both patient and surgeon satisfaction. We look forward to continued success together.”

About Corin Group

Corin is a European orthopaedic manufacturer based in the UK that markets its products throughout the world.

Corin is committed to:

…improving patient satisfaction with personalized technologies that optimize our clinically proven joint replacements
…delivering a personal approach to our customers, combining the spirit of our local companies with the strength of our global, integrated organization
…empowering and rewarding our global talented teams to deliver excellence to our customers

For further information about Corin, please visit www.coringroup.com.

This news release contains forward-looking statements. These statements appear in a number of places in this news release and include statements regarding our intentions, beliefs or current expectations, concerning, among other things, our results of operations, turnover, financial condition, liquidity, prospects, growth, strategies, new products, the level of new launches and the markets in which we operate. Readers are cautioned that any such forward-looking statements are not guarantees of future performance and involve risks and uncertainties, and that actual results may differ markedly from those in the forward-looking statements as a result of various factors. We undertake no obligation publicly to revise any forward-looking statements, except as may be required by law.


SOURCE Corin USA

Related Links

http://www.coringroup.com


board_of_directors.jpg

February 23, 2017 OrthoSpineNews

Minimus Spine, manufacturer of the Triojection® system for herniated spinal discs, is announcing the appointment of Jeffrey R. Binder to its Board of Directors. Mr. Binder was the CEO of Biomet from 2007 until it was acquired for approximately $14 billion by Zimmer Holdings in 2015. Mr. Binder is currently the President and CEO of Immucor. Prior to his time at Biomet, Mr. Binder was president of Abbott Diagnostics from 2006 to 2007 and the CEO of Spinal Concepts from 2000 until it was acquired by Abbott Laboratories in 2003 and became Abbott Spine. Prior to Spinal Concepts, Mr. Binder was President of Depuy Orthopedics and he has spent most of his career in orthopedics and spine.

David Hooper, PhD, Minimus Spine’s President and CEO said, “Jeff brings a wealth of intellect and experience to Minimus. He has successfully orchestrated several significant transactions in spine and orthopedics and is unquestionably a blue-chip addition as we strengthen the team around Triojection. Our management team and board worked together at Spinal Concepts. While that was a great result, the market need has expanded far beyond spinal hardware. We share the vision that Minimus is part of the future of spine and we expect continued success as we plan the initial commercial launch of Triojection in Europe this summer.”

Mr. Binder added: “I am very pleased to join the board of this exciting and innovative young company. Clinicians and patients are searching for solutions that address spinal disorders and reduce pain with less invasive approaches. I’m looking forward to working again with David and fellow director Wes Johnson, who were both so instrumental to our success at Spinal Concepts.”

Minimus Spine is dedicated to the non-surgical treatment of disc herniation patients using an intradiscal injection of ozone gas to the herniated disc. Minimus Spine is the manufacturer of the Triojection System, which involves a sterile, single-use, syringe cartridge that is processed in the operating room using the Triojection console. Triojection provides the physician with confidence in both the sterility of the procedure and the concentration of ozone delivered to the patient.


Xtant-Medical-side-panels1.png

February 23, 2017 OrthoSpineNews

BELGRADE, Mont., Feb. 22, 2017 (GLOBE NEWSWIRE) — Xtant Medical Holdings, Inc. (NYSE MKT:XTNT), a leader in the development of regenerative medicine products and medical devices, today announced the appointment of Carl O’Connell as the permanent CEO, effective February 17th, 2017. Mr. O’Connell previously served as president of Xtant since October of 2016 and was appointed as interim CEO on January 21st, 2017.

Prior to joining Xtant Medical, Mr. O’Connell most recently served as the Vice President Global Marketing – Extremities for Wright Medical, a recognized leader in the global foot and ankle market. Mr. O’Connell lead marketing teams and initiatives that were instrumental in achieving US growth initiatives that exceeded 28%, and 23% globally. He also lead the completion of marketing integration of 3 acquired businesses within a year, recruited top talent to his team, and supported the launch of multiple product line extensions and new products, including the successful launch of the market leading Infinity Total Ankle. During his tenure as Global Vice President Marketing for Stryker Spine, Mr. O’Connell drove marketing leadership and brand differentiation programs to support a 20% growth imperative, which was achieved through strategic cross divisional collaboration and the successful launches of line extensions and product upgrades. Mr. O’Connell served as the President and CEO of MedSurg – ITOCHU International, a division of ITOCHU Corporation, the 3rd largest Japanese trading corporation with over $70B in sales transactions, where he was responsible for the reorganization of three recently impaired acquisitions by supporting success attributes, acquiring new vendor contracts, stabilizing and growing top line sales at double digit growth rates, and driving the division to profitability.

“We are proud to announce Carl O’Connell has been promoted to the position of CEO” said Kent Swanson, Chairman of Xtant Medical’s Board of Directors. “With his extensive leadership in the medical device industry and commercialization expertise, we are confident that he is the right choice to lead Xtant to new levels of growth and profitability. Since joining the organization as President in 2016, he has made significant contributions to the record performance of the Company in Q4 2016 and we share his enthusiasm for the outlook of the Company.”

“I am excited to lead what I feel has the potential to be a world-class organization and a considerable competitor in the market” said Carl O’Connell, now CEO of Xtant Medical. “Since joining the organization, I have had a chance to assess the talented Xtant Medical team, the quality of our products, the commitment to our customers, the respect for the gift of donation, and the opportunity that lies ahead. I look forward to continuing to work with this team, expanding upon our recent successes and continuing to establish the strategic course to take Xtant Medical to the next level.  I am appreciative of the confidence bestowed in me by the executive management team, the board of directors, and our stakeholders.”

Carl O’Connell has over 30 years of experience in the healthcare and medical device arena. In addition to the positions held above, Mr. O’Connell also served as a Principal at Hudson Healthcare Partners, and President for Carl Zeiss Surgical, Inc. Mr. O’Connell’s responsibilities have spanned from global marketing, sales, manufacturing, leadership development, regulatory affairs, corporate quality systems, research, product and business development functions. Carl received a bachelor’s degree in Psychology and an M.B.A. from Mount St. Mary’s College, Maryland. Through the span of his career, Mr. O’Connell has launched more than 100 products and participated in numerous M&A events.

About Xtant Medical

Xtant Medical develops, manufactures and markets regenerative medicine products and medical devices for domestic and international markets. Xtant Medical products serve the specialized needs of orthopedic and neurological surgeons, including orthobiologics for the promotion of bone healing, implants and instrumentation for the treatment of spinal disease, tissue grafts for the treatment of orthopedic disorders, and biologics to promote healing following cranial, and foot and ankle surgeries. With core competencies in both biologic and non-biologic surgical technologies, Xtant Medical can leverage its resources to successfully compete in global neurological and orthopedic surgery markets. For further information, please visit www.xtantmedical.com.

Important Cautions Regarding Forward-looking Statements

This press release contains certain disclosures that may be deemed forward-looking statements within the meaning of the Private Securities Litigation Reform Act of 1995 that are subject to significant risks and uncertainties. Forward-looking statements include statements that are predictive in nature, that depend upon or refer to future events or conditions, or that include words such as “continue,” “efforts,” “expects,” “anticipates,” “intends,” “plans,” “believes,” “estimates,” “projects,” “forecasts,” “strategy,” “will,” “goal,” “target,” “prospects,” “potential,” “optimistic,” “confident,” “likely,” “probable” or similar expressions or the negative thereof.

Statements of historical fact also may be deemed to be forward-looking statements. We caution that these statements by their nature involve risks and uncertainties, and actual results may differ materially depending on a variety of important factors, including, among others: our ability to integrate the acquisition of X-spine Systems, Inc. and any other business combinations or acquisitions successfully; our ability to remain listed on the NYSE MKT; our ability to obtain financing on reasonable terms; our ability to increase revenue; our ability to comply with the covenants in our credit facility; our ability to maintain sufficient liquidity to fund our operations; the ability of our sales force to achieve expected results; our ability to remain competitive; government regulations; our ability to innovate and develop new products; our ability to obtain donor cadavers for our products; our ability to engage and retain qualified technical personnel and members of our management team; the availability of our facilities; government and third-party coverage and reimbursement for our products; our ability to obtain regulatory approvals; our ability to successfully integrate recent and future business combinations or acquisitions; our ability to use our net operating loss carry-forwards to offset future taxable income; our ability to deduct all or a portion of the interest payments on the notes for U.S. federal income tax purposes; our ability to service our debt; product liability claims and other litigation to which we may be subjected; product recalls and defects; timing and results of clinical studies; our ability to obtain and protect our intellectual property and proprietary rights; infringement and ownership of intellectual property; our ability to remain accredited with the American Association of Tissue Banks; influence by our management; our ability to pay dividends; our ability to issue preferred stock; and other factors.

Additional risk factors are listed in the Company’s Annual Report on Form 10-K and Quarterly Reports on Form 10-Q under the heading “Risk Factors.” You should carefully consider the trends, risks and uncertainties described in this document, the Form 10-K and other reports filed with or furnished to the SEC before making any investment decision with respect to our securities. If any of these trends, risks or uncertainties actually occurs or continues, our business, financial condition or operating results could be materially adversely affected, the trading prices of our securities could decline, and you could lose all or part of your investment. The Company undertakes no obligation to release publicly any revisions to any forward-looking statements to reflect events or circumstances after the date hereof or to reflect the occurrence of unanticipated events, except as required by law. All forward-looking statements attributable to us or persons acting on our behalf are expressly qualified in their entirety by this cautionary statement.

Investor Contact 
CG CAPITAL
Rich Cockrell 
877.889.1972
investorrelations@cg.capital 

Company Contact
Xtant Medical 
Molly Mason
mmason@xtantmedical.com

Medtronic-e1421166824372.jpg

February 22, 2017 OrthoSpineNews

DUBLIN – February 21, 2017 – Medtronic plc (NYSE:MDT) today announced financial results for its third quarter of fiscal year 2017, which ended January 27, 2017.

The company reported third quarter worldwide revenue of $7.283 billion, an increase of 5 percent, or 6 percent on a constant currency basis.  Foreign currency exchange had a negative $40 million impact on revenue.  Third quarter GAAP net income and diluted earnings per share (EPS) were $821 million and $0.59, decreases of 25 percent and 23 percent, respectively.  Third quarter non-GAAP net income and diluted EPS were $1.553 billion and $1.12, representing increases of 3 percent and 6 percent, respectively.  After adjusting for the negative 5 cent impact from foreign currency exchange, non-GAAP diluted EPS increased 10 percent.

“In Q3, we achieved solid results across all of our business groups and geographies,” said Omar Ishrak, Medtronic chairman and chief executive officer. “At the same time, we produced meaningful operating profit growth based largely on our synergy programs from the Covidien integration, as well as our focus on operating excellence initiatives.”

The third quarter GAAP operating margin was 15.7 percent, a 380 basis point decline.  The third quarter non-GAAP operating margin was 28.2 percent, a 40 basis point improvement.  After adjusting for the 90 basis point negative impact from foreign currency exchange, the third quarter non-GAAP operating margin was 29.1 percent, representing a 130 basis point improvement.

U.S. revenue of $4.106 billion represented 56 percent of company revenue and increased 4 percent.  Non-U.S. developed market revenue of $2.193 billion represented 30 percent of company revenue and increased 6 percent, or 7 percent on a constant currency basis.  Emerging market revenue of $984 million represented 14 percent of company revenue and increased 9 percent, or 11 percent on a constant currency basis.

Cardiac and Vascular Group

The Cardiac and Vascular Group (CVG) includes the Cardiac Rhythm & Heart Failure (CRHF), Coronary & Structural Heart (CSH), and Aortic & Peripheral Vascular (APV) divisions.  CVG worldwide revenue of $2.548 billion increased 5 percent, or 6 percent on a constant currency basis, driven by high-single digit constant currency growth in CRHF and APV, and low-single digit constant currency growth in CSH.

  • CRHF revenue of $1.371 billion increased 7 percent, or 8 percent on a constant currency basis, with mid-single digit constant currency growth in Arrhythmia Management, high-teens constant currency growth in Heart Failure, and low-double digit constant currency growth in Services & Solutions.  Arrhythmia Management growth was driven in part by the continued adoption of the Arctic Front Advance® cryoballoons and Reveal LINQ® insertable cardiac monitoring systems.  Heart Failure growth was driven in part by the company’s first quarter acquisition of HeartWare International, Inc.
  • CSH revenue of $751 million increased 2 percent, or 3 percent on a constant currency basis, with low-double digit constant currency growth in Structural Heart, partially offset by mid-single digit constant currency declines in Coronary.  Structural Heart growth was driven in part by the recent U.S. launch of the CoreValve® Evolut® R 34 mm transcatheter aortic heart valve.  Coronary had double-digit constant currency declines in drug-eluting stents in the U.S. and Japan.
  • APV revenue of $426 million increased 6 percent on both a reported and constant currency basis, with high-single digit growth in Peripheral Vascular and mid-single digit growth in Aortic.  Growth was driven by the continued adoption of the company’s Endurant® IIs stent graft, IN.PACT® Admiral® drug-coated balloon, as well as the recent launch of the HawkOne(TM) 6 French directional atherectomy system.

Minimally Invasive Therapies Group

The Minimally Invasive Therapies Group (MITG) includes the Surgical Solutions and the Patient Monitoring & Recovery (PMR) divisions.  MITG worldwide revenue of $2.417 billion increased 5 percent, or 6 percent on a constant currency basis, with high-single digit constant currency growth in Surgical Solutions and mid-single digit constant currency growth in PMR.

  • Surgical Solutions revenue of $1.343 billion increased 6 percent, or 7 percent on a constant currency basis, driven primarily by its Open to Minimally Invasive Surgery growth initiative, including innovative new products in Advanced Stapling and Advanced Energy, including endo stapling specialty reloads, the Valleylab(TM) FT10 energy platform, and LigaSure(TM) vessel sealing instruments.  The division also benefitted from the second quarter acquisition of Smith & Nephew’s gynecology business.
  • PMR revenue of $1.074 billion increased 5 percent on both a reported and constant currency basis.  This is a result of strong growth in the Airways and Ventilation business, driven by continued adoption of the Puritan Bennett(TM) 980 ventilator, and in the Patient Monitoring business, driven by strength in Nellcor(TM) pulse oximetry.  PMR also benefitted from the fiscal year 2016 fourth quarter acquisition of Bellco in the Renal Care Solutions business.

Restorative Therapies Group

The Restorative Therapies Group (RTG) includes the Spine, Brain Therapies, Specialty Therapies, and Pain Therapies divisions.  RTG worldwide revenue of $1.817 billion increased 4 percent on both a reported and constant currency basis.  Group results were driven by high-single digit growth in Brain Therapies, mid-single digit growth in Specialty Therapies, and low-single digit growth in Spine, offsetting declines in Pain Therapies, all on a constant currency basis.

  • Spine revenue of $657 million increased 3 percent on both a reported and constant currency basis, the division’s strongest growth in over 7 years.  Core Spine grew in the low-single digits on a constant currency basis, as the focus on “Speed-to-Scale” new product launches continues to drive improved results.  BMP also grew in the low-single digits on a constant currency basis.
  • Brain Therapies revenue of $518 million increased 7 percent, or 8 percent on a constant currency basis.  Neurovascular grew in the low-double digits on a constant currency basis, driven in part by sales of the Axium(TM) Prime Extra Soft detachable coil and the Pipeline(TM) Flex embolization device.  Neurosurgery grew in the high-single digits on a constant currency basis, driven by strong growth in navigation capital equipment and disposables, as well as continued solid adoption of the O-arm® O2 surgical imaging system.  Brain Modulation grew in the low-single digits on a constant currency basis on the strength of the company’s MR conditional Activa® DBS portfolio.
  • Specialty Therapies revenue of $370 million increased 4 percent, or 5 percent on a constant currency basis.  All three businesses contributed to growth, with Advanced Energy growing in the low-double digits, Pelvic Health growing in the mid-single digits, and ENT growing in the low-single digits, all on a constant currency basis.
  • Pain Therapies revenue of $272 million decreased 3 percent, or 2 percent on a constant currency basis.  After adjusting for the divestiture of the division’s drug business, which occurred in the third quarter of fiscal year 2016, Pain Therapies revenue was flat on both a reported and constant currency basis.  Pain Therapies had low-single digit constant currency declines in Spinal Cord Stimulation, as the business faced competitive pressures, and low-single digit constant currency declines in Drug Pumps, partially offset by high-single digit constant currency growth in the Interventional business.

Diabetes Group

The Diabetes Group includes the Intensive Insulin Management (IIM), Non-Intensive Diabetes Therapies (NDT), and Diabetes Service & Solutions (DSS) divisions.  Diabetes Group worldwide revenue of $501 million increased 6 percent, or 7 percent on a constant currency basis, with all three divisions contributing to growth.

  • IIM grew in the low double-digits on a constant currency basis, with low double-digit growth in the U.S. driven by strong interest in the MiniMed® 630G system and the Priority Access Program for the MiniMed® 670G system.  In addition, the division delivered high-single digit constant currency growth in international markets as a result of continued strong sales in Europe and Asia Pacific of the MiniMed® 640G system.  The division continues to be on track for a spring U.S. launch of the MiniMed® 670G system, the world’s first hybrid closed loop insulin delivery system.
  • NDT grew in the high-teens on a constant currency basis, led by the sales of the iPro®2 Professional Continuous Glucose Monitor (CGM) technology with Pattern Snapshot to primary care physicians.
  • DSS grew in the low-single digits on a constant currency basis, with double-digit constant currency growth in international markets as a result of strong growth in consumables and Diabeter clinic revenue, offsetting low-single digit U.S. declines.

Outlook and Guidance

The company today reiterated its fiscal year 2017 revenue outlook, EPS guidance, and free cash flow outlook.

The company continues to expect fiscal year 2017 revenue growth to be within the mid-single digit range on a constant currency, constant weeks basis, which is consistent with the company’s long-term, mid-single digit constant currency revenue growth expectation.  The company expects revenue growth for the fourth quarter of fiscal year 2017 to be in the lower half of the mid-single digit range on a constant currency basis.  While the impact from foreign currency exchange is fluid, if current exchange rates remain similar for the remainder of the fiscal year, the company’s full year revenue and fourth fiscal quarter would both be negatively affected by approximately $20 million to $40 million.

The company continues to expect fiscal year 2017 diluted non-GAAP EPS growth to be in the double digits on a constant currency, constant week basis, which is consistent with the company’s long-term, double digit constant currency EPS growth expectation.  Taking into account the estimated 8 to 10 cent impact from the extra week in the first quarter last fiscal year, the estimated negative impact from foreign currency exchange of approximately 20 cents, and assuming current exchange rates remain similar for the rest of the year, this growth guidance implies fiscal year 2017 non-GAAP diluted EPS in the range of $4.55 to $4.60.

For fiscal year 2017, the company continues to expect free cash flow to be in the range of $5 billion to $6 billion.

“We remain confident in our ability to deliver mid-single digit constant currency revenue growth and double-digit constant currency EPS growth, not only in our current fiscal year, but also into the future,” said Ishrak. “With our differentiated growth platforms and leadership in strong healthcare growth markets, we believe we are well positioned to create long-term, dependable value for our shareholders.”

Webcast Information

Medtronic will host a webcast today, February 21, at 8:00 a.m. EST (7:00 a.m. CST) to provide information about its businesses for the public, investors, analysts, and news media.  This quarterly webcast can be accessed by clicking on the Investor Events link at investorrelations.medtronic.com and this earnings release will be archived at newsroom.medtronic.com.  Medtronic will be live tweeting during the webcast on our Newsroom Twitter account, @Medtronic.  Within 24 hours of the webcast, a replay of the webcast and transcript of the company’s prepared remarks will be available by clicking on the Investor Events link at investorrelations.medtronic.com.

Financial Schedules

To view the third quarter financial schedules and non-GAAP reconciliations, click here.  To view the third quarter earnings presentation, click here.  Both of these documents can also be accessed by visiting newsroom.medtronic.com.

About Medtronic

Medtronic plc (www.medtronic.com), headquartered in Dublin, Ireland, is among the world’s largest medical technology, services and solutions companies – alleviating pain, restoring health and extending life for millions of people around the world.  Medtronic employs more than 88,000 people worldwide, serving physicians, hospitals and patients in approximately 160 countries.  The company is focused on collaborating with stakeholders around the world to take healthcare Further, Together.

FORWARD LOOKING STATEMENTS

This press release contains forward-looking statements related to product and service growth drivers, market position and opportunities, the transforming healthcare environment, strategies for and sustainability of growth, benefits from collaborations and acquisitions, availability of and plans for cash, the creation of shareholder value and shareholder returns, product launches, and Medtronic’s future results of operations, which are subject to risks and uncertainties, such as competitive factors, difficulties and delays inherent in the development, manufacturing, marketing and sale of medical products, challenges with respect to third-party collaborations and integration of acquired businesses, effectiveness of growth and restructuring strategies, challenges relating to our worldwide operations, challenges or unforeseen risks in implementing our growth strategies, government regulation, fluctuations in foreign currency exchange rates, future revenue and earnings growth, and general economic conditions and other risks and uncertainties described in Medtronic’s periodic reports and other filings with the U.S. Securities and Exchange Commission (the “SEC”). Anticipated results only reflect information available to Medtronic at this time and may differ from actual results. Medtronic does not undertake to update its forward-looking statements or any of the information contained in this press release. Certain information in this press release includes calculations or figures that have been prepared internally and have not been reviewed or audited by our independent registered public accounting firm, including but not limited to, certain information in the financial schedules accompanying this press release. Use of different methods for preparing, calculating or presenting information may lead to differences and such differences may be material.

NON-GAAP FINANCIAL MEASURES

This press release contains financial measures and guidance, including free cash flow figures (defined as operating cash flows less property, plant and equipment additions), revenue and growth rates on a constant currency basis, net income, and diluted EPS, all of which are considered “non-GAAP” financial measures under applicable SEC rules and regulations. Unless otherwise noted, all revenue amounts given in this press release are stated in accordance with U.S. generally accepted accounting principles (GAAP). References to quarterly figures increasing or decreasing are in comparison to the third quarter of fiscal year 2016.

Medtronic management believes that in order to properly understand its short-term and long-term financial trends, including period over period comparisons of the company’s operations, investors may find it useful to exclude the effect of certain charges or gains that contribute to or reduce earnings but that result from transactions or events that management believes may or may not recur with similar materiality or impact to operations in future periods (Non-GAAP Adjustments). Medtronic generally uses non-GAAP financial measures to facilitate management’s review of the operational performance of the company and as a basis for strategic planning. Non-GAAP financial measures should be considered supplemental to and not a substitute for financial information prepared in accordance with GAAP, and investors are cautioned that Medtronic may calculate non-GAAP financial measures in a way that is different from other companies. Management strongly encourages investors to review the company’s consolidated financial statements and publicly filed reports in their entirety. Reconciliations of the non-GAAP financial measures to the most directly comparable GAAP financial measures are included in the financial schedules accompanying this press release.

Medtronic calculates forward-looking non-GAAP financial measures based on internal forecasts that omit certain amounts that would be included in GAAP financial measures.  For instance, forward-looking revenue growth and EPS projections exclude the impact of foreign currency exchange fluctuations. Forward-looking non-GAAP EPS guidance also excludes other potential charges or gains that would be recorded as non-GAAP adjustments to earnings during the fiscal year, such as amortization of intangible assets and acquisition-related, certain tax and litigation, and restructuring charges or gains. Medtronic does not attempt to provide reconciliations of forward-looking non-GAAP EPS guidance to projected GAAP EPS guidance because the combined impact and timing of recognition of these potential charges or gains is inherently uncertain and difficult to predict and is unavailable without unreasonable efforts. In addition, we believe such reconciliations would imply a degree of precision and certainty that could be confusing to investors. Such items could have a substantial impact on GAAP measures of financial performance.

-end-

View FY17 Third Quarter Financial Schedules & Non-GAAP Reconciliations

View FY17 Third Quarter Earnings Presentation

Contacts:

Fernando Vivanco

Public Relations

+1-763-505-3780

Ryan Weispfenning

Investor Relations

+1-763-505-4626

This announcement is distributed by Nasdaq Corporate Solutions on behalf of Nasdaq Corporate Solutions clients.

The issuer of this announcement warrants that they are solely responsible for the content, accuracy and originality of the information contained therein.

Source: Medtronic plc via Globenewswire


This article appears in: News Headlines

Referenced Stocks: MDT

Read more: http://www.nasdaq.com/press-release/medtronic-reports-third-quarter-financial-results-20170221-00332#ixzz4ZRpevyDv