Park City, UT

3 days / 6 sessions
Current Issues in Spine

February 2-4, 2017

orthofix.jpg

October 30, 2017 OrthoSpineNews

October 30, 2017

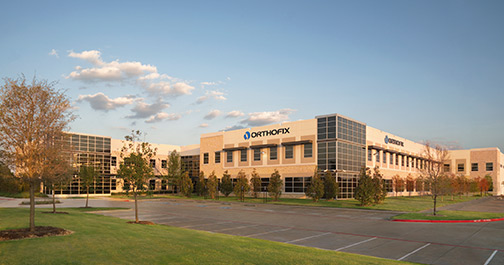
LEWISVILLE, Texas–(BUSINESS WIRE)–Orthofix International N.V. (NASDAQ:OFIX) today reported its financial results for the third quarter ended September 30, 2017. Net sales were $105.2 million, diluted earnings per share from continuing operations was $0.18 and adjusted earnings per share from continuing operations was $0.42.

“We continue to execute on our strategy of increasing the organic growth and profitability of each of our four strategic business units while rationalizing corporate costs in all areas. This has resulted in an accelerating sales growth rate each quarter thus far this year, and positioned us for solid mid-single digit organic revenue growth and the opportunity for meaningful margin expansion in the years to come,” said Brad Mason, President and Chief Executive Officer.

Financial Results Overview

The following table provides net sales by strategic business unit (“SBU”):

Three Months Ended September 30,
(Unaudited, U.S. Dollars, in thousands) 2017 2016 Change Constant

Currency

Change

BioStim $ 44,427 $ 42,956 3.4 % 3.4 %
Biologics 15,218 14,335 6.2 % 6.2 %
Extremity Fixation 25,447 24,314 4.7 % 1.4 %
Spine Fixation 20,155 16,892 19.3 % 19.1 %
Net sales $ 105,247 $ 98,497 6.9 % 6.0 %

Gross profit increased $2.9 million to $81.5 million. Gross margin decreased to 77.5% compared to 79.8% in the prior year period due primarily to sales mix, the impact of converting to stocking distributors in Brazil in our Extremity Fixation SBU, and $0.6 million of non-recurring expenses relating to our U.S. restructuring plan. Non-GAAP net margin, an internal metric that we define as gross profit less sales and marketing expenses, was $34.0 million compared to $36.9 million in the prior year period. The decrease in non-GAAP net margin was primarily due to higher commission expenses from geographic mix in Extremity Fixation and higher rates from Spine Fixation and Biologics distributors, as well as increased sales and use tax benefits realized in the third quarter of 2016.

Net income from continuing operations was $3.3 million, or $0.18 per share, compared to $10.4 million, or $0.56 per share in the prior year period. Adjusted net income from continuing operations was $7.7 million, or $0.42 per share, compared to adjusted net income of $6.6 million, or $0.36 per share in the prior year period.

EBITDA was $14.5 million, compared to $14.1 million in the prior year period. Adjusted EBITDA was $21.1 million, or 20.1% of net sales, for the third quarter, compared to $23.5 million, or 23.9% of net sales, in the prior year period.

Liquidity

As of September 30, 2017, cash and cash equivalents were $53.9 million compared to $39.6 million as of December 31, 2016. As of September 30, 2017, we had no outstanding indebtedness and borrowing capacity of $125 million. Cash flow from operations was $23.5 million, a decrease of $14.9 million, and free cash flow was $10.2 million, a decrease of $13.9 million when compared to the prior year period.

2017 Outlook

For the year ending December 31, 2017, the Company expects the following results, assuming exchange rates are the same as those currently prevailing.

Previous 2017 Outlook Current 2017 Outlook
(Unaudited, U.S. Dollars, in millions, except per share data) Low High Low High
Net sales $ 422.0 $ 425.0 $ 428.0

(1)

$ 431.0

(1)

Net income from continuing operations $ 17.7 $ 21.4 $ 14.2

(2)

$ 17.0

(2)

Adjusted EBITDA $ 79.0 $ 81.0 $ 79.0

(3)

$ 82.0

(3)

EPS from continuing operations $ 0.96 $ 1.16 $ 0.77

(4)

$ 0.92

(4)

Adjusted EPS from continuing operations $ 1.54 $ 1.60 $ 1.54

(5)

$ 1.63

(5)

Represents a year-over-year increase of 4.4% to 5.2% on a reported basis
Represents a year-over-year increase of 306.1% to 386.1%
Represents a year-over-year decrease of 0.4% to an increase of 3.4%
Represents a year-over-year increase of 305.3% to 384.2%
Represents a year-over-year increase of 5.5% to 11.6%

Conference Call

Orthofix will host a conference call today at 4:30 PM Eastern time to discuss the Company’s financial results for the third quarter of 2017. Interested parties may access the conference call by dialing (844) 809-1992 in the U.S. and (612) 979-9886 outside the U.S., and referencing the conference ID 2078866. A replay of the call will be available for two weeks by dialing (855) 859-2056 in the U.S. and (404) 537-3406 outside the U.S., and entering the conference ID 2078866. A webcast of the conference call may be accessed by going to the Company’s website at www.orthofix.com, by clicking on the Investors link and then the Events and Presentations page.

About Orthofix

Orthofix International N.V. is a diversified, global medical device company focused on improving patients’ lives by providing superior reconstructive and regenerative orthopedic and spine solutions to physicians worldwide. Headquartered in Lewisville, Texas, the Company has four strategic business units: BioStim, Biologics, Extremity Fixation and Spine Fixation. Orthofix products are widely distributed via the Company’s sales representatives and distributors. In addition, Orthofix is collaborating on research and development activities with leading clinical organizations such as Brown University, Sinai Hospital of Baltimore, Cleveland Clinic, Texas Scottish Rite Hospital for Children, and the Musculoskeletal Transplant Foundation. For more information, please visit www.orthofix.com.

Forward-Looking Statements

This communication contains forward-looking statements within the meaning of Section 21E of the Securities Exchange Act of 1934, as amended (“the Exchange Act”), and Section 27A of the Securities Act of 1933, as amended, relating to our business and financial outlook, which are based on our current beliefs, assumptions, expectations, estimates, forecasts and projections. In some cases, you can identify forward-looking statements by terminology such as “may,” “will,” “should,” “expects,” “plans,” “anticipates,” “believes,” “estimates,” “projects,” “intends,” “predicts,” “potential,” or “continue” or other comparable terminology. These forward-looking statements are not guarantees of our future performance and involve risks, uncertainties, estimates and assumptions that are difficult to predict. Therefore, our actual outcomes and results may differ materially from those expressed in these forward-looking statements. You should not place undue reliance on any of these forward-looking statements. Further, any forward-looking statement speaks only as of the date hereof, unless it is specifically otherwise stated to be made as of a different date. We undertake no obligation to further update any such statement, or the risk factors described in Part I, Item 1A under the heading Risk Factors in our Form 10-K for the year ended December 31, 2016, to reflect new information, the occurrence of future events or circumstances or otherwise.

ORTHOFIX INTERNATIONAL N.V.

Condensed Consolidated Statements of Operations
Three Months Ended Nine Months Ended
September 30, September 30,
(Unaudited, U.S. Dollars, in thousands, except share and per share data) 2017 2016 2017 2016
Net sales $ 105,247 $ 98,497 $ 316,927 $ 301,251
Cost of sales 23,717 19,880 69,475 64,533
Gross profit 81,530 78,617 247,452 236,718
Sales and marketing 47,493 41,717 146,496 132,582
General and administrative 18,068 19,272 56,759 54,822
Research and development 6,935 6,858 21,246 21,294
Charges related to U.S. Government resolutions 1,499 14,369
Operating income 9,034 9,271 22,951 13,651
Interest income (expense), net (15 ) 471 106 320
Other income (expense), net 479 (634 ) (3,284 ) 1,346
Income before income taxes 9,498 9,108 19,773 15,317
Income tax benefit (expense) (6,150 ) 1,276 (13,998 ) (6,703 )
Net income from continuing operations 3,348 10,384 5,775 8,614
Discontinued operations
Income (loss) from discontinued operations 65 (1,018 ) (1,762 ) (3,580 )
Income tax benefit 43 530 642 1,258
Net income (loss) from discontinued operations 108 (488 ) (1,120 ) (2,322 )
Net income $ 3,456 $ 9,896 $ 4,655 $ 6,292
Net income (loss) per common share—basic
Net income from continuing operations $ 0.18 $ 0.57 $ 0.32 $ 0.47
Net income (loss) from discontinued operations 0.01 (0.02 ) (0.06 ) (0.13 )
Net income per common share—basic $ 0.19 $ 0.55 $ 0.26 $ 0.34
Net income (loss) per common share—diluted
Net income from continuing operations $ 0.18 $ 0.56 $ 0.31 $ 0.46
Net income (loss) from discontinued operations 0.01 (0.02 ) (0.06 ) (0.12 )
Net income per common share—diluted $ 0.19 $ 0.54 $ 0.25 $ 0.34
Weighted average number of common shares:
Basic 18,180,845 18,091,650 18,071,093 18,238,533
Diluted 18,572,791 18,382,118 18,394,542 18,569,861
ORTHOFIX INTERNATIONAL N.V.
Condensed Consolidated Balance Sheets
(U.S. Dollars, in thousands except share data) September 30,

2017

December 31,

2016

(unaudited)
Assets
Current assets
Cash and cash equivalents $ 53,925 $ 39,572
Restricted cash 14,369
Accounts receivable, net of allowances of $8,925 and $8,396, respectively 61,187 57,848
Inventories 80,124 63,346
Prepaid expenses and other current assets 18,172 19,238
Total current assets 213,408 194,373
Property, plant and equipment, net 46,678 48,916
Patents and other intangible assets, net 9,915 7,461
Goodwill 53,565 53,565
Deferred income taxes 47,052 47,325
Other long-term assets 15,683 20,463
Total assets $ 386,301 $ 372,103
Liabilities and shareholders’ equity
Current liabilities
Accounts payable $ 13,352 $ 14,353
Other current liabilities 60,718 69,088
Total current liabilities 74,070 83,441
Other long-term liabilities 26,920 25,185
Total liabilities 100,990 108,626
Contingencies
Shareholders’ equity
Common shares $0.10 par value; 50,000,000 shares authorized; 18,212,916 and

17,828,155 issued and outstanding as of September 30, 2017 and December 31,

2016, respectively

1,821 1,783
Additional paid-in capital 215,778 204,095
Retained earnings 68,834 64,179
Accumulated other comprehensive loss (1,122 ) (6,580 )
Total shareholders’ equity 285,311 263,477
Total liabilities and shareholders’ equity $ 386,301 $ 372,103

ORTHOFIX INTERNATIONAL N.V.
Non-GAAP Financial Measures

The following tables present reconciliations of net income (loss) from continuing operations, earnings per share (“EPS”) from continuing operations, gross profit, and net cash from operating activities, in each case calculated in accordance with U.S. generally accepted accounting principles (“GAAP”), to, as applicable, non-GAAP financial measures, referred to as “EBITDA,” “Adjusted EBITDA,” “Adjusted net income from continuing operations,” “Adjusted earnings per share from continuing operations,” “Non-GAAP net margin” and “Free cash flow” that exclude items specified in the tables. A more detailed explanation of the items excluded from these non-GAAP financial measures, as well as why management believes the non-GAAP financial measures are useful to them, is included following the reconciliations.

EBITDA and Adjusted EBITDA

Three Months Ended

September 30,

Nine Months Ended

September 30,

(Unaudited, U.S. Dollars, in thousands) 2017 2016 2017 2016
Net income from continuing operations $ 3,348 $ 10,384 $ 5,775 $ 8,614
Interest expense (income), net 15 (471 ) (106 ) (320 )
Income tax expense (benefit) 6,150 (1,276 ) 13,998 6,703
Depreciation and amortization 4,974 5,480 15,421 15,483
EBITDA $ 14,487 $ 14,117 $ 35,088 $ 30,480
Share-based compensation 3,632 7,862 9,124 11,874
Foreign exchange impact (794 ) 566 (2,425 ) (1,434 )
Strategic investments 293 (62 ) 9,619 342
SEC / FCPA matters and related costs 1,150 691 1,851 1,481
Infrastructure investments 827 3,073
Legal judgments/settlements 179 (3,000 ) 1,798 (3,000 )
Charges related to U.S. Government resolutions 1,499 14,369
Restructuring 2,160 2,242
Succession charges 1,026 1,026
Adjusted EBITDA $ 21,107 $ 23,526 $ 57,297 $ 58,211
As a % of net sales 20.1 % 23.9 % 18.1 % 19.3 %

Adjusted Net Income from Continuing Operations

Three Months Ended

September 30,

Nine Months Ended

September 30,

(Unaudited, U.S. Dollars, in thousands) 2017 2016 2017 2016
Net income from continuing operations $ 3,348 $ 10,384 $ 5,775 $ 8,614
Foreign exchange impact (794 ) 566 (2,425 ) (1,434 )
Strategic investments 293 (62 ) 9,619 342
SEC / FCPA matters and related costs 1,150 691 1,851 1,481
Infrastructure investments 827 3,073
Legal judgments/settlements 179 (3,000 ) 1,798 (3,000 )
Charges related to U.S. Government resolutions 1,499 14,369
Restructuring 2,160 2,242
Succession charges 1,026 1,026
Long-term income tax rate adjustment 1,405 (5,325 ) 1,512 (5,143 )
Adjusted net income from continuing operations $ 7,741 $ 6,606 $ 20,372 $ 19,328

Adjusted Earnings per Share from Continuing Operations

Three Months Ended

September 30,

Nine Months Ended

September 30,

(Unaudited, per diluted share) 2017 2016 2017 2016
EPS from continuing operations $ 0.18 $ 0.56 $ 0.31 $ 0.46
Foreign exchange impact (0.04 ) 0.03 (0.13 ) (0.08 )
Strategic investments 0.02 0.52 0.02
SEC / FCPA matters and related costs 0.06 0.04 0.10 0.08
Infrastructure investments 0.04 0.17
Legal judgments/settlements 0.01 (0.16 ) 0.10 (0.16 )
Charges related to U.S. Government resolutions 0.08 0.77
Restructuring 0.12 0.12
Succession charges 0.06 0.06
Long-term income tax rate adjustment 0.07 (0.29 ) 0.09 (0.28 )
Adjusted EPS from continuing operations $ 0.42 $ 0.36 $ 1.11 $ 1.04
Weighted average number of diluted common shares 18,572,791 18,382,118 18,394,542 18,569,861

Non-GAAP Net Margin

Three Months Ended

September 30,

Nine Months Ended

September 30,

(Unaudited, U.S. Dollars, in thousands) 2017 2016 2017 2016
Gross profit $ 81,530 $ 78,617 $ 247,452 $ 236,718
Sales and marketing (47,493 ) (41,717 ) (146,496 ) (132,582 )
Non-GAAP net margin $ 34,037 $ 36,900 $ 100,956 $ 104,136
BioStim $ 18,285 $ 19,996 $ 54,887 $ 54,980
Biologics 6,010 6,821 18,651 19,642
Extremity Fixation 7,723 8,834 20,901 24,170
Spine Fixation 2,122 1,388 6,825 5,925
Corporate (103 ) (139 ) (308 ) (581 )
Non-GAAP net margin $ 34,037 $ 36,900 $ 100,956 $ 104,136

Free Cash Flow

Nine Months Ended

September 30,

(Unaudited, U.S. Dollars, in thousands) 2017 2016
Net cash from operating activities $ 23,494 $ 38,396
Capital expenditures (13,290 ) (14,261 )
Free cash flow $ 10,204 $ 24,135

2017 Outlook

Previous 2017 Outlook Current 2017 Outlook
(Unaudited, U.S. Dollars, in millions) Low High Low High
Net income from continuing operations $ 17.7 $ 21.4 $ 14.2 $ 17.0
Interest expense, net 0.2 0.1
Income tax expense 15.7 15.5 16.7 17.0
Depreciation and amortization 20.0 20.0 20.2 20.2
EBITDA $ 53.6 $ 57.0 $ 51.1 $ 54.2
Share-based compensation 13.0 13.0 13.0 13.0
Foreign exchange impact (1.6 ) (1.6 ) (2.4 ) (2.4 )
Strategic investments 10.3 9.3 10.2 10.2
SEC / FCPA matters and related costs 1.2 1.0 2.4 2.4
Legal judgments/settlements 1.6 1.6 1.8 1.8
Restructuring 0.9 0.7 2.9 2.8
Adjusted EBITDA $ 79.0 $ 81.0 $ 79.0 $ 82.0
Previous 2017 Outlook Current 2017 Outlook
(Unaudited, per diluted share) Low High Low High
EPS from continuing operations $ 0.96 $ 1.16 $ 0.77 $ 0.92
Foreign exchange impact (0.09 ) (0.09 ) (0.13 ) (0.13 )
Strategic investments 0.56 0.51 0.55 0.55
SEC / FCPA matters and related costs 0.07 0.05 0.13 0.13
Legal judgments/settlements 0.09 0.09 0.10 0.10
Restructuring 0.05 0.04 0.16 0.15
Long-term income tax rate adjustment (0.10 ) (0.16 ) (0.04 ) (0.09 )
Adjusted EPS from continuing operations $ 1.54 $ 1.60 $ 1.54 $ 1.63
Weighted average number of diluted common shares 18,400,000 18,400,000 18,400,000 18,400,000

Non-GAAP Measures:

Constant Currency

Constant currency is a non-GAAP measure, which is calculated by using foreign currency rates from the comparable, prior-year period, to present net sales at comparable rates. Constant currency can be presented for numerous GAAP measures, but is most commonly used by management to analyze net sales without the impact of changes in foreign currency rates.

EBITDA

EBITDA is a non-GAAP financial measure, which is calculated by adding interest income (expense), net; income tax expense; and depreciation and amortization to net income (loss) from continuing operations. EBITDA provides management with additional insight to its results of operations.

Adjusted EBITDA, Adjusted Net Income from Continuing Operations and Adjusted Earnings per Share from Continuing Operations

These non-GAAP financial measures provide management with additional insight to its results of operations and are calculated using the following adjustments:

  • Share-based compensation – costs related to our share-based compensation plans, which include stock options, restricted stock awards, performance-based restricted stock awards, market-based restricted stock awards and our stock purchase plan
  • Foreign exchange impact – gains and losses related to foreign currency transactions; guidance presented does not include the impact of any future foreign exchange fluctuations
  • Strategic investments – costs related to our strategic investments, including our investment in eNeura, Inc.
  • SEC / FCPA matters and related costs – legal and other professional fees associated with the SEC Investigation, Securities Class Action Complaint and Brazil subsidiary compliance review
  • Infrastructure investments – costs associated with our multi-year process and systems improvement effort, “Bluecore,” which was completed in 2016
  • Legal judgments/settlements – adverse or favorable legal judgments or negotiated legal settlements
  • Charges related to U.S. Government resolutions – charges related to the settlement with the SEC as further discussed in our Form 10-K for the year ended December 31, 2016
  • Restructuring – costs related to a planned restructuring, primarily consisting of severance charges and the write-down of certain assets
  • Succession charges – costs related to the succession of certain of our former named executive officers
  • Long-term income tax rate adjustment – reflects management’s expectation of a long-term normalized effective tax rate of 38%, which is based on current tax law and current expected income. Actual tax expense will ultimately be based on GAAP performance and may differ from the 38% effective tax rate due to a variety of factors, including jurisdictions in which profits are determined to be earned and taxed, and discrete items, such as the resolutions of issues arising from tax audits with various tax authorities and the ability to realize deferred tax assets

Non-GAAP Net Margin

Non-GAAP net margin is an internal non-GAAP metric, which we define as gross profit less sales and marketing expense. Non-GAAP net margin is the primary metric used by our Chief Operating Decision Maker in managing our business.

Free Cash Flow

Free cash flow is a non-GAAP financial measure, which is calculated by subtracting capital expenditures from cash flow from operating activities. Free cash flow is an important indicator of how much cash is generated or used by our normal business operations, including capital expenditures. Management uses free cash flow as a measure of progress on its capital efficiency and cash flow initiatives.

Usefulness and Limitations of Non-GAAP Financial Measures

Management uses non-GAAP measures to evaluate performance period-over-period, to analyze the underlying trends in our business, to assess performance relative to competitors and to establish operational goals and forecasts that are used in allocating resources. Management uses these non-GAAP measures as the basis for assessing the ability of the underlying operations to generate cash. In addition, management uses these non-GAAP measures to further its understanding of the performance of our business units.

Material Limitations Associated with the Use of Non-GAAP Financial Measures

The non-GAAP measures used in this press release may have limitations as analytical tools, and should not be considered in isolation or as a replacement for GAAP financial measures. Some of the limitations associated with the use of these non-GAAP financial measures are that they exclude items that reflect an economic cost and can have a material effect on cash flows. Similarly, certain non-cash expenses, such as share-based compensation, do not directly impact cash flows, but are part of total compensation costs accounted for under GAAP.

Compensation for Limitations Associated with Use of Non-GAAP Financial Measures

We compensate for the limitations of our non-GAAP financial measures by relying upon GAAP results to gain a complete picture of our performance. The GAAP results provide the ability to understand our performance based on a defined set of criteria. The non-GAAP measures reflect the underlying operating results of our businesses, which we believe is an important measure of our overall performance. We provide a detailed reconciliation of the non-GAAP financial measures to our most directly comparable GAAP measures, and encourage investors to review this reconciliation.

Usefulness of Non-GAAP Financial Measures to Investors

We believe that providing non-GAAP financial measures that exclude certain items provides investors with greater transparency to the information used by senior management in its financial and operational decision-making. Management believes it is important to provide investors with the same non-GAAP metrics it uses to supplement information regarding the performance and underlying trends of our business operations in order to facilitate comparisons to its historical operating results and internally evaluate the effectiveness of our operating strategies. Disclosure of these non-GAAP financial measures also facilitates comparisons of our underlying operating performance with other companies in the industry that also supplement their GAAP results with non-GAAP financial measures.

Contacts

Orthofix International N.V.
Mark Quick, 214-937-2924
markquick@orthofix.com

AAEAAQAAAAAAAAK-AAAAJGU5YmZlNWM4LTEwNWItNDQyMC1iMmEwLTkyOWVjOTQwZDU1Mg.png

October 30, 2017 OrthoSpineNews

October 30, 2017

GAINESVILLE, Fla.–(BUSINESS WIRE)–Exactech, Inc. (Nasdaq: EXAC), a developer and producer of bone and joint restoration products and biologic solutions for extremities, knee and hip, announced today that revenue for the third quarter of 2017 increased 2% to $61.4 million from $59.9 million in the third quarter of 2016, and 2% on a constant currency basis. Domestic revenue increased 2% to $43.3 million, and international revenue increased 2% to $18.1 million in the third quarter of 2017. Diluted earnings per share for the third quarter was $0.20 based on net income of $2.9 million, compared to third quarter 2016 net income of $3.2 million and diluted earnings per share of $0.22.

Third Quarter Segment Performance

  • Extremities revenue increased 18% to $27.7 million from $23.4 million, an 18% constant currency increase
  • Knee revenue decreased 3% to $16.5 million, a 3% constant currency decrease
  • Hip revenue decreased 3% to $11.3 million from $11.6 million, a 3% constant currency decrease
  • Other revenue decreased 25% to $5.9 million from $7.9 million, a 27% constant currency decrease. The Other segment includes an aggregation of the former Biologics and Spine segment

Nine Months Highlights and Segment Performance

For the first nine months of 2017, revenue was $198.2 million, an increase of 4% over $191.3 million for the comparable period last year. On a constant currency basis, revenue for the first nine months of 2017 was up 4%. Net income for the first nine months of 2017 was $12.3 million, or $0.84 per diluted share compared to $12.0 million, or $0.84 per diluted share, for the first nine months of 2016. First nine month product revenue was as follows:

  • Extremities revenue increased 19% to $87.1 million, a 19% constant currency increase
  • Knee revenue was flat at $56.2 million, flat on constant currency
  • Hip revenue decreased 2% to $35.0 million, a 1% constant currency decrease
  • Other revenue decreased 24% to $20.0 million, a 24% constant currency decrease

Management Comment

Exactech CEO and President David Petty said, “For the first nine months of 2017, we reported a 4% increase in our revenue. During the third quarter, we continued to work on launch plans for the new Truliant® knee system, Vantage® ankle, ExactechGPS® shoulder application, and Alteon® H.A. hip stem and are very pleased with the early response we hear from surgeon users,” Petty said.

Chief Financial Officer Jody Phillips said, “Gross margins increased to 70.3% from 68.7% for the third quarter a year ago. Total operating expenses for the quarter increased 7% to $39.2 million. As a result, our net income decreased 10% to $2.9 million and $0.20 diluted EPS for the third quarter which was in the range of our expectations.”

On October 23, 2017, Exactech announced that it had entered into a definitive agreement with TPG Capital to go private. It is expected the transaction will be closed in early 2018.

The financial statements are below.

About Exactech

Based in Gainesville, Fla., Exactech develops and markets orthopaedic implant devices, related surgical instruments and biologic materials and services to hospitals and physicians. The company manufactures many of its orthopaedic devices at its Gainesville facility. Exactech’s orthopaedic products are used in the restoration of bones and joints that have deteriorated as a result of injury or diseases such as arthritis. Exactech markets its products in the United States, in addition to more than 30 markets in Europe, Latin America, Asia and the Pacific. Additional information about Exactech can be found at http://www.exac.com.

This release contains various forward-looking statements within the meaning of Section 27A of the Securities Act of 1933 and Section 21E of the Securities Exchange Act of 1934, which represent the company’s expectations or beliefs concerning future events of the company’s financial performance. These forward-looking statements are further qualified by important factors that could cause actual results to differ materially from those in the forward-looking statements. These factors include the effect of competitive pricing, the company’s dependence on the ability of third party manufacturers to produce components on a basis which is cost-effective to the company, market acceptance of the company’s products and the effects of government regulation. Results actually achieved may differ materially from expected results included in these statements.

EXACTECH, INC. AND SUBSIDIARIES

CONSOLIDATED BALANCE SHEETS
(in thousands)
(unaudited) (audited)
September 30, December 31,
2017 2016

ASSETS

CURRENT ASSETS:
Cash and cash equivalents $ 11,718 $ 13,052
Trade receivables, net of allowances of $2,043 and $1,473 56,940 53,051
Prepaid expenses and other assets, net 3,585 3,075
Income taxes receivable 895 2,140
Inventories, current 69,885 65,264
Assets held for sale 6,477
Total current assets 143,023 143,059
PROPERTY AND EQUIPMENT:
Land 4,550 4,474
Machinery and equipment 45,622 42,034
Surgical instruments 146,827 132,134
Furniture and fixtures 4,715 4,700
Facilities 23,062 21,726
Projects in process 6,739 2,473
Total property and equipment 231,515 207,541
Accumulated depreciation (111,434 ) (100,234 )
Net property and equipment 120,081 107,307
OTHER ASSETS:
Deferred financing, deposits and other 4,416 968
Equity investment 1,916 2,047
Deferred tax asset 887
Non-current inventory 12,799 15,723
Product licenses and designs, net 8,994 9,102
Patents and trademarks, net 664 821
Customer relationships, net 452 476
Goodwill 14,860 13,819
Total other assets 44,101 43,843

TOTAL ASSETS

$ 307,205 $ 294,209
LIABILITIES AND SHAREHOLDERS’ EQUITY
CURRENT LIABILITIES:
Accounts payable $ 18,338 $ 17,566
Income taxes payable 568 780
Accrued expenses 13,547 11,832
Other current liabilities 2,616 2,927
Total current liabilities 35,069 33,105
LONG-TERM LIABILITIES:
Deferred tax liabilities 4,181 1,773
Long-term debt, net of current portion 14,000 20,000
Other long-term liabilities 3,653 5,089
Total long-term liabilities 21,834 26,862
Total liabilities 56,903 59,967
COMMITMENTS AND CONTINGENCIES
SHAREHOLDERS’ EQUITY:
Common stock 145 144
Additional paid-in capital 91,051 87,319
Treasury Stock (3,042 ) (3,042 )
Accumulated other comprehensive loss, net of tax (8,561 ) (8,611 )
Retained earnings 170,709 158,432
Total shareholders’ equity 250,302 234,242
TOTAL LIABILITIES AND SHAREHOLDERS’ EQUITY $ 307,205 $ 294,209

EXACTECH, INC. AND SUBSIDIARIES

CONDENSED CONSOLIDATED STATEMENTS OF INCOME

(in thousands, except per share amounts)

(Unaudited)
Three Month Periods Nine Month Periods
Ended September 30, Ended September 30,
2017 2016 2017 2016
NET SALES $ 61,404 $ 59,919 $ 198,213 $ 191,341
COST OF GOODS SOLD 18,232 18,772 59,927 59,408
Gross profit 43,172 41,147 138,286 131,933
OPERATING EXPENSES:
Sales and marketing 22,713 21,684 71,335 68,838
General and administrative 5,908 5,186 18,065 16,740
Research and development 5,729 5,096 17,333 15,495
Depreciation and amortization 4,892 4,592 14,283 13,326
Total operating expenses 39,242 36,558 121,016 114,399
INCOME FROM OPERATIONS 3,930 4,589 17,270 17,534
OTHER INCOME (EXPENSE):
Interest income 32 29 87 35
Other income (loss) (28 ) 43 300 115
Interest expense (229 ) (186 ) (693 ) (716 )
Foreign currency exchange gain 470 73 1,200 665
Total other income (expenses) 245 (41 ) 894 99
INCOME BEFORE INCOME TAXES 4,175 4,548 18,164 17,633
PROVISION FOR INCOME TAXES 1,277 1,383 5,756 5,680
INCOME BEFORE EQUITY IN LOSS OF INVESTEE 2,898 3,165 12,408 11,953
EQUITY IN LOSS OF INVESTEE, NET OF TAX (36 ) (131 )
NET INCOME $ 2,862 $ 3,165 $ 12,277 $ 11,953
BASIC EARNINGS PER SHARE $ 0.20 $ 0.22 $ 0.86 $ 0.85
DILUTED EARNINGS PER SHARE $ 0.20 $ 0.22 $ 0.84 $ 0.84
SHARES – BASIC 14,352 14,123 14,315 14,108
SHARES – DILUTED 14,613 14,370 14,578 14,303

Contacts

Exactech
Investor contacts:
Jody Phillips, 352-377-1140
Executive Vice President of Finance & Chief Financial Officer
or
Priscilla Bennett, 352-377-1140
Priscilla@exac.com


Building2-e1509384325711-1.jpg

October 30, 2017 OrthoSpineNews

FRANKLIN, Mass.Oct. 30, 2017 /PRNewswire/ — Arthrosurface, Inc. announced today that it has completed the acquisition of an acellular dermal stabilization device technology, including the intellectual property rights to and associated with this technology, from WASAS, LLC based in Fort Lauderdale, Florida. Arthrosurface plans to use this technology to develop and market a platform of novel methods to be used to correct orthopedic challenges in multiple therapeutic areas.

Acellular dermis is derived from a human source, a process is used to remove cells and retain portions of the extracellular matrix (ECM). Dermal allografts have a history of human use in a wide range of clinical indications.

“The availability of this allograft to Arthrosurface will allow us to execute on a pipeline of clinical applications that we have identified with our surgeon partners over the past several years,” said Steve Ek, CEO of Arthrosurface.

About Arthrosurface

Arthrosurface, Inc. is a global orthopedic medical technology business providing a broad portfolio of essential products and instrumentation used to treat upper and lower extremity orthopedic conditions caused by trauma, injury and arthritic disease. The product offerings include devices, instruments and orthobiologics designed to preserve and restore the joints so patients can regain and maintain an active lifestyle. The Company offers a variety of unique systems that provide less invasive technologies for surgeons that can be used to treat a wide range of joint conditions. Founded in 2002, Arthrosurface markets and distributes its products in the US and around the world and has succeeded in helping patients return to activity for over 13 years. For more information, please go to our website at www.arthrosurface.com


SOURCE Arthrosurface, Inc.

Related Links

http://arthrosurface.com


gsmedical-building.jpg

October 30, 2017 OrthoSpineNews

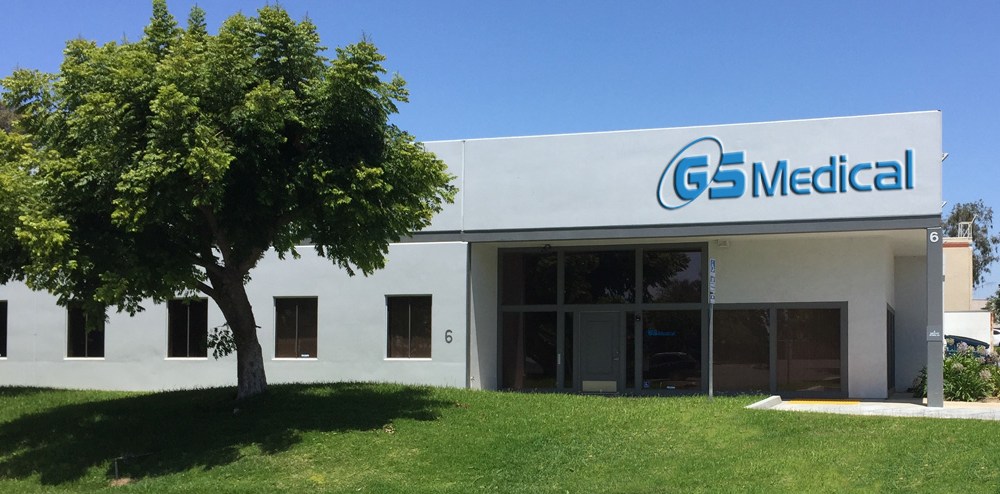
IRVINE, Calif.Oct. 25, 2017 /PRNewswire/ — Today, GS Solutions Inc., DBA GS Medical USA (GSM), a U.S. supplier of spinal implants and instrumentation and provider of high-quality surgical solutions, announced the full launch of the AnyPlus® Direct Lateral Interbody Fusion (DLIF) System after three months of an alpha launch period, and the Anterior and Posterior Disc Prep Sets.

Following strong sales growth of 32% in Q2 2017 versus the prior quarter, the GSM leadership team expects continued, positive growth for Q4 2017 and FY2018, supported by the launch of the aforementioned products.

“The company’s success thus far is in large part thanks to our strong relationship with surgeon partners and distributors, and we are thrilled to offer these new products in our portfolio of spinal solutions,” said James Shin, CEO. The company’s newest Direct Lateral System will be streamlined with unique features that offer many implant and instrument options to complement surgeon preferences.

“We understand the ever-evolving needs of our surgeon partners, and we continually strive to develop new and innovative implants and instrumentation, with the ultimate goal of providing value-enhanced, multi-faceted surgical solutions and outstanding patient care.” GSM continues to make further advancements in engineering and development with the recent growth of its spine products portfolio.

Earlier this year GSM expanded its offerings within several other systems including the AnyPlus® Anterior Cervical Interbody Fusion (ACIF) System, the AnyPlus® Dual Lead Screw System, and an anterior cervical plate solution. GSM is also finalizing the launch of the company’s Chrome Cobalt Rod System for scoliosis application, as well as making upgrades to its AnyPlus® NX Percutaneous Pedicle Screw System to provide for better user experience. In the coming months, GSM looks to launch its advanced, Stand-Alone interbody system and Posterior Cervical application, as well expand distribution partnerships with preferred partners who offer DBM, Allograft and Kyphoplasty.

“We expect that the remainder of this year and 2018 will continue to be strong for GSM as we have a number of products in development,” said Kurt Neesley, U.S. Sales and Business Development Director. Given the company’s expanded suite of product offerings, GSM expects demand for the company’s spinal solutions to increase substantially.

“We are focused on growing our sales team and curating a strong network of distributor partnerships to meet surgeon demand,” Neesley stated. “GSM is committed to providing best-in-class service to our distributors and surgeons to promote better patient outcomes.”

For more information about distributor partnership opportunities, please contact kneesley@gsmedicalusa.com.

Media Relations Contact:
Amanda Collins
182068@email4pr.com  I  Phone: 949.380.6385 x213
FAX: 866.600.9712
6 Wrigley
Irvine, CA 92618
www.gsmedicalusa.com

SOURCE GS Medical


maxresdefault-1.jpg

October 27, 2017 OrthoSpineNews

FARMINGDALE, N.Y., Oct. 25, 2017 (GLOBE NEWSWIRE) — Misonix, Inc. (NASDAQ:MSON), a provider of minimally invasive therapeutic ultrasonic medical devices that enhance clinical outcomes, today cited data that demonstrated the use of BoneScalpel can produce up to a 40% cost reduction in biologic grafting material spend in spinal fusion procedures.

The data was presented today by Dr. Wade Jensen of the Center for Neurosciences, Orthopaedics & Spine (“CNOS”), at the 32nd Annual Meeting of the North American Spine Society (“NASS”) in Orlando, Florida.  The data showed an average cost savings of $1,066 in bone graft material when the Misonix BoneScalpel was employed compared to the use of standard power drill instruments. The Misonix BoneScalpel ultrasonically cuts bone using a 1mm thick blunt blade. The result is a clean cut that preserves healthy bone which can be used for grafting, and spares the surrounding soft tissue. The study is based on a retrospective analysis including 144 cases, 44 of which were done using the Misonix BoneScalpel. The remaining 100 cases were done with a 3mm rotating matchstick drill bit (“burr”) currently in broad use in surgical suites throughout the U.S. An estimated $1.9 billion is spent annually on bone graft substitutes.

Stavros Vizirgianakis, President and Chief Executive Officer of Misonix, said, “The data presented today are a strong validation of the efficacy of the BoneScalpel in producing significant cost savings in the surgical suite. This data demonstrates the value of using ultrasonic bone removal over standard electric power instruments both in the precision of the bone removal and the reduction in overall bone destruction. The ability to ultrasonically remove bone in a manner that enhances the ability for successful bone grafting while minimizing the need for biological grafting material represents an important step forward for patients, surgeons and medical institutions. We believe that the BoneScalpel can become the standard of care for precision bone cutting while sparing soft tissue and delivering significant cost savings to the healthcare process.”

Misonix will be exhibiting at NASS 2017 at booth #765 from Wednesday, October 25, 2017 through Saturday, October 28, 2017.

About NASS
The North American Spine Society (“NASS”) is a global multidisciplinary medical society that utilizes education, research and advocacy to foster the highest quality, ethical, ​value- and evidence-based spine care for patients.

About Misonix
Misonix, Inc. designs, develops, manufactures and markets therapeutic ultrasonic medical devices. Misonix’s therapeutic ultrasonic platform is the basis for several innovative medical technologies. Addressing a combined market estimated to be in excess of $1.5 billion annually; Misonix’s proprietary ultrasonic medical devices are used in spine surgery, neurosurgery, orthopedic surgery, wound debridement, cosmetic surgery, laparoscopic surgery, and other surgical and medical applications.  Additional information is available on the Company’s Web site at www.misonix.com.

Safe Harbor Statement
With the exception of historical information contained in this press release, content herein may contain “forward looking statements” that are made pursuant to the Safe Harbor Provisions of the Private Securities Litigation Reform Act of 1995. These statements are based on management’s current expectations and are subject to uncertainty and changes in circumstances. Investors are cautioned that forward-looking statements involve risks and uncertainties that could cause actual results to differ materially from the statements made. These factors include general economic conditions, delays and risks associated with the performance of contracts, risks associated with international sales and currency fluctuations, uncertainties as a result of research and development, acceptable results from clinical studies, including publication of results and patient/procedure data with varying levels of statistical relevancy, risks involved in introducing and marketing new products, potential acquisitions, consumer and industry acceptance, litigation and/or court proceedings, including the timing and monetary requirements of such activities, the timing of finding strategic partners and implementing such relationships, regulatory risks including approval of pending and/or contemplated 510(k) filings, the ability to achieve and maintain profitability in the Company’s business lines, the impact of the pending investigation by the Department of Justice and Securities Exchange Commission, and other factors discussed in the Company’s Annual Report on Form 10-K, subsequent Quarterly Reports on Form 10-Q and Current Reports on Form 8-K. The Company disclaims any obligation to update its forward-looking relationships.

Corporate Contact
Misonix Contact:
Joe Dwyer
631-694-9555
invest@misonix.com

Investor Contact
Joe Diaz
Lytham Partners
602-889-9700
info@misonix.com


medacta-shoulder-system-70-1.jpg

October 27, 2017 OrthoSpineNews

October 26, 2017

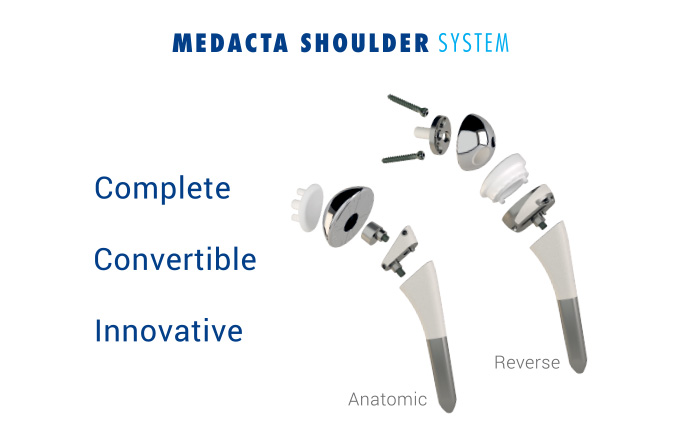
CHICAGO–(BUSINESS WIRE)–Medacta International, developer of innovative surgical techniques and products for the hip, knee, spine, and sports medicine disciplines, recently expanded its expertise to the world of shoulder surgery. The family-owned orthopedics leader today announced it has received FDA clearance for the Anatomic Shoulder and Reverse Shoulder components of its modular Medacta Shoulder System. The company also announced the successful completion of the first surgery in the United States utilizing the system, which was performed by Matthew D. Saltzman, M.D., Associate Professor of Orthopaedic Surgery at the Northwestern Memorial Hospital in Chicago, Illinois.

“The procedure went very well,” said Dr. Saltzman, who specializes in shoulder and elbow surgeries and has been practicing orthopedics for 14 years. “The Medacta Shoulder System’s instrumentation and implants allow for impressive anatomic restoration, resulting in an efficient surgery and, hopefully, improved patient outcomes.”

The Medacta Shoulder System, unveiled in February 2017 following its first ever surgery in Europe, is a modular solution that features a broad range of options, including wide-ranging sizes, adjustable offset, and innovative configurations. Developed by an international team of expert surgeons, the platform offers the modularity and compatibility demanded by today’s marketplace, while still respecting anatomic conversion from primary to reverse.

The Shoulder System is also supported by the Medacta Orthopaedic Research and Education (M.O.R.E.) Institute’s Clinical Excellence Program and is part of a multi-center, post-marketing, prospective, open clinical study that will collect clinical and radiological outcomes for the next ten years. The M.O.R.E. Institute provides continuous educational and developmental support to Medacta surgeons as they work towards discovering new technologies and supporting patients.

“The new Medacta Shoulder System is a continuation of our effort to improve orthopedic implant design and configurability for the benefit of both surgeons and their patients,” said Francesco Siccardi, Executive Vice President of Medacta International. “This latest surgery in the United States marks a milestone for Medacta in line with our company’s patient-centric vision and the same ambition that has helped us become a leader in knee, hip, and spine technology.”

Medacta will launch the Shoulder System for the U.S. market at the American Academy of Orthopaedic Surgeons Annual Meeting, which will be held in New Orleans in March 2018. For more information about Medacta, please visit medacta.com or follow @Medacta on Twitter.

About Medacta International

Medacta® International is a world leading manufacturer of orthopedic implants, neurosurgical systems, and instrumentation. Medacta’s revolutionary approach and responsible innovation have resulted in standard of care breakthroughs in hip replacement with the AMIS® system and total knee replacement with MyKnee® patient matched technology. Over the last 10 years, Medacta has grown dramatically by taking a different approach and placing value on all aspects of the care experience from design to training to sustainability. Medacta is headquartered in Castel San Pietro, Switzerland, and operates in over 30 countries. To learn more about Medacta International, please visit www.medacta.com or follow @Medacta on Twitter.

Contacts

For Medacta International, Inc.
Jill Bongiorni, 516-729-2250
Jill@torchcomllc.com


cingal-package.png

October 26, 2017 OrthoSpineNews

October 25, 2017

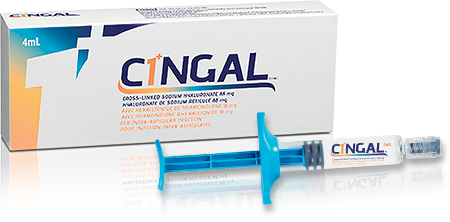
BEDFORD, Mass.–(BUSINESS WIRE)–Anika Therapeutics, Inc. (NASDAQ: ANIK), a global, integrated orthopedics medicines company specializing in therapeutics based on its proprietary hyaluronic acid (“HA”) technology, today announced the completion of enrollment in its second pivotal Phase III trial evaluating CINGAL®, its novel HA-corticosteroid combination viscosupplement1 for the treatment of symptoms associated with osteoarthritis (“OA”) of the knee.

CINGAL is poised to be the first and only viscosupplement in the U.S. market to combine triamcinolone hexacetonide, a well-established, FDA-approved steroid utilized to treat inflammation, with Anika’s proprietary cross-linked, non-animal-derived hyaluronic acid, which is the active ingredient in the company’s global market-leading viscosupplements, ORTHOVISC® and MONOVISC®. The second pivotal Phase III trial, which will evaluate 576 patients with mild to moderate knee osteoarthritis, is designed to evaluate the safety of CINGAL as well as its effectiveness in improving pain, function, and quality of life measures over a 26-week period, in comparison to MONOVISC and triamcinolone hexacetonide.

“We’re proud to have rapidly achieved this major milestone on the path to seeking U.S. regulatory approval for CINGAL, which is key to driving future growth for the company and adding to our market leadership position in orthobiologics,” said Charles H. Sherwood, Ph.D., Chief Executive Officer of Anika Therapeutics. “With its novel and proprietary combination of two proven treatments, and its demonstrated ability to provide immediate and long-lasting pain relief, CINGAL will bridge a significant gap in the non-invasive, non-opioid osteoarthritis treatment landscape, which has not seen a major innovation for over a decade.”

Anika recently published results from its initial Phase III trial, which formed the basis for CINGAL’s Health Canada and CE Mark approvals in November 2015 and March 2016, respectively. The trial, which compared the safety and efficacy of CINGAL to MONOVISC and placebo (saline), showed that CINGAL provided superior short term pain relief after injection as compared to HA alone, and superior relief from OA-related pain, stiffness, and function through 26 weeks as compared to placebo (saline).

Anika expects to complete the CINGAL second pivotal Phase III trial in the first half of 2018 and anticipates FDA approval the following year.

About Anika Therapeutics, Inc.

Anika Therapeutics, Inc. (NASDAQ: ANIK) is a global, integrated orthopedic medicines company based in Bedford, Massachusetts. Anika is committed to improving the lives of patients with degenerative orthopedic diseases and traumatic conditions with clinically meaningful therapies along the continuum of care, from palliative pain management to regenerative cartilage repair. The Company has over two decades of global expertise developing, manufacturing, and commercializing more than 20 products based on its proprietary hyaluronic acid (HA) technology. Anika’s orthopedic medicine portfolio includes ORTHOVISCMONOVISC, and CINGAL, which alleviate pain and restore joint function by replenishing depleted HA, and HYALOFAST®, a solid HA-based scaffold to aid cartilage repair and regeneration. For more information about Anika, please visit www.anikatherapeutics.com.

Forward-Looking Statements

The statements made in the first sentences of the second, third, and fifth paragraphs of this press release, which are not statements of historical fact, are forward-looking statements within the meaning of Section 27A of the Securities Act of 1933, as amended, and Section 21E of the Securities Exchange Act of 1934, as amended. These statements include, but are not limited to, those relating to driving the Company’s future growth and the Company’s expectations regarding completion of the second pivotal Phase III study for CINGAL and FDA approval of CINGAL. These statements are based upon the current beliefs and expectations of the Company’s management and are subject to significant risks, uncertainties, and other factors. The Company’s actual results could differ materially from any anticipated future results, performance, or achievements described in the forward-looking statements as a result of a number of factors including, but not limited to, (i) the Company’s ability to successfully commence and/or complete clinical trials of its products on a timely basis or at all; (ii) the Company’s ability to obtain pre-clinical or clinical data to support domestic and international pre-market approval applications, 510(k) applications, or new drug applications, or to timely file and receive FDA or other regulatory approvals or clearances of its products; (iii) that such approvals will not be obtained in a timely manner or without the need for additional clinical trials, other testing or regulatory submissions, as applicable; (iv) the Company’s research and product development efforts and their relative success, including whether we have any meaningful sales of any new products resulting from such efforts; (v) the cost effectiveness and efficiency of the Company’s clinical studies, manufacturing operations, and production planning; (vi) the strength of the economies in which the Company operates or will be operating, as well as the political stability of any of those geographic areas; (vii) future determinations by the Company to allocate resources to products and in directions not presently contemplated; (viii) the Company’s ability to successfully commercialize its products, in the U.S. and abroad; (ix) the Company’s ability to provide an adequate and timely supply of its products to its customers; and (x) the Company’s ability to achieve its growth targets. Additional factors and risks are described in the Company’s periodic reports filed with the Securities and Exchange Commission, and they are available on the SEC’s website at www.sec.gov. Forward-looking statements are made based on information available to the Company on the date of this press release, and the Company assumes no obligation to update the information contained in this press release.

1 Viscosupplements are injected by a licensed medical professional into synovial joints to replenish the natural cushioning within joints that depletes with age and degenerative orthopedic diseases, causing pain.

Contacts

For Investor Inquiries:
Anika Therapeutics, Inc.
Sylvia Cheung, 781-457-9000
Chief Financial Officer
or
For Media Inquiries:
Pure Communications
Sonal Vasudev, 917-523-1418
sonal@purecommunicationsinc.com


global-e1509050543859.png

October 26, 2017 OrthoSpineNews
Warren, NJ, October 26, 2017 –(PR.com)– NJ-based Prosidyan (www.prosidyan.com), developer of proprietary fiber-based bioactive glass products, announced today FDA 510(k) clearance and full commercial launch of FIBERGRAFT BG Matrix – Bone Graft Substitute for Postero-lateral Spinal Fusion. FIBERGRAFT BG Matrix is the third generation product in the company’s FIBERGRAFT line of bioactive glass fiber based products. FIBERGRAFT BG Matrix leverages the direct connectivity of fibers with an exponentially increased surface area and optimized resorption rates delivered using Prosidyan’s proprietary type I collagen based bioactive carrier.

FIBERGRAFT BG Matrix – Bone Graft Substitute is indicated only for bony voids or gaps that are not intrinsic to the stability of the bony structure. FIBERGRAFT BG Matrix is indicated to be gently packed into bony voids or gaps of the skeletal system (i.e., posterolateral spine). These defects may be surgically created osseaous defects or osseous defects created from traumatic injury to the bone. The product provides a bone void filler that resorbs and is replaced with bone during the healing process. FIBERGRAFT BG Matrix must be used with autogenous bone marrow aspirate and autograft in posterolateral spine.

Here are some comments from the early users of FIBERGRAFT BG Matrix:
Dr. Paul Slosar MD of the San Francisco Spine Institute commented, “I have an interest in the growing scientific research focused on bone graft extenders and am impressed by the FiberGraft’s basic science data. I recently had the opportunity to use the Fibergraft Matrix in several cases where I needed to augment my posterior fusion, when we didn’t have enough autograft. The Fibergraft had excellent handling characteristics and interdigitated very nicely with the host bone. The Fibergraft provided me with an excellent option to reinforce my bone graft and, based on their scientific data, I anticipate excellent clinical fusion results.”

Dr. Adam Bruggeman MD of the Texas Spine Care Center commented, “Fibergraft Matrix from Prosidyan is an innovative update to their leading fiber based bioglass portfolio. Matrix is easy to manipulate, allowing for multiple applications. It is now my preferred graft for all biologic applications in the spine.”

Dr. Todd Allen, MD, PhD Associate Professor Orthopaedic Surgery UCSD commented, “The structural and handling features are dynamic and second to none with an innate ability to wrap around bony structures and wick needed blood and cells to the region. The structural and biologic capabilities of this unique synthetic are powerful, and make this a great product for the future of spine surgery, both in open and MIS applications.”

Prosidyan’s Founder & CEO Charanpreet Bagga informed that FIBERGRAFT BG Matrix was presented at the 2017 North American Spine Society Innovative Technology Presentations on October 25th by Dr. William Walsh PhD, of UNSW. There were only seven technologies selected for presentation at this forum and FIBERGRAFT is the only synthetic bone graft substitute selected for this prestigious forum.

Prosidyan was founded in 2009 to develop a family of synthetic bioactive bone graft substitutes based on microscopic fibers of bioactive glass. Prosidyan’s first product, FIBERGRAFT BG Morsels, a synthetic bone graft substitute, received FDA clearance in March 2014. The firm’s second product in the line, FIBERGRAFT BG Putty, received FDA clearance in March 2015, and comprises FIBERGRAFT BG Morsels delivered through Prosidyan’s proprietary bioactive carrier, OSSIGLIDE. To date, FIBERGRAFT products have been implanted in over 9,000 patients across the U.S. Prosidyan is poised to revolutionize synthetic bioactive bone graft options, with numerous patents and a robust pipeline of products in late stages of development.

Distribution Opportunities are still available. Contact Sales@prosidyan.com

About Prosidyan: Prosidyan is the creator and supplier of the next generation in synthetic bone grafting through its proprietary manufacturing process utilizing microscopic fibers of bioactive glass. For more information about the company and its products, please visit www.prosidyan.com, or call 908.517.3666.

Contact Information
Prosidyan, Inc.
Charanpreet S. Bagga
(908)-517-3666
Contact
www.prosidyan.com

100-4-1.jpeg

October 26, 2017 OrthoSpineNews

UNION CITY, Calif.Oct. 25, 2017 /PRNewswire/ — Mizuho OSI®, a leading manufacturer of specialty surgical tables, pressure management solutions, and table specific patient care kits, is introducing its newest technology, the Levó Head Positioning System at NASS 2017. Using an innovative electro-mechanical technology to enable the device’s motion, the Levó System introduces a new level of actuated control and precision to head positioning for all spine procedures from cervical to sacrum. The Company is unveiling the technology in booth #717 for physicians to experience the elevated positioning capabilities afforded by Levó.

Positioning patients for spine surgery is essential for optimal operating conditions and operative site exposure. The Levó System is designed to provide the surgical team with an interface that is safe, fast, and easy to engage. The technology’s unique interface places the surgeon in control, supporting initial head positioning and cervical spine corrections throughout the procedure. Various interchangeable modules that support the use of a skull clamp or face pillow comprise a versatile platform that delivers optimal utilization within each practice.

Designed to provide fluid, yet controlled motion, Levó’s functionality supports an improved workflow and enhanced surgical access. This is achieved through key modules, including the QuickConnect System, which supports the efficient attachment of a skull clamp, and the Control Handles, which allow for intraoperative adjustments.

“In designing the Levó System, we wanted to offer surgeons a seamless and flexible solution that affords them better control over patient positioning during these delicate procedures,” said Greg Neukirch, vice president of Marketing and Sales at Mizuho OSI. “We’re proud to unveil a solution we believe works to enhance clinicians’ surgical experience, providing for safe and precise care when positioning a patient’s head for all prone spine procedures.”

Mizuho OSI is offering hands-on demonstrations of the Levó Head Positioning System at NASS 2017 in Orlando, Fla. from October 25-27 in Booth #717.

About Mizuho OSI

Mizuho OSI® is a U.S. based company and the leader in the markets for specialty surgery and patient positioning. The company’s portfolio includes specialty surgical tables for procedure-specific approaches that improves patient outcomes in spine and orthopedic surgeries, a range of general surgical tables, and consumable surgical patient care products. Mizuho OSI products are sold direct in the U.S. and Germany, and by the Mizuho Corporation in Japan. Both companies sell their products and solutions worldwide through authorized international distributors. Mizuho OSI is a wholly owned subsidiary of Mizuho Corporation located in Tokyo, Japan, a leading surgical table manufacturer in Asia. The Mizuho Group also includes Trilux Medical®, a subsidiary of Mizuho OSI. Trilux Medical is a provider and manufacturer of surgical lights, surgical pendants, operating room patient integration, video management systems, and turn-key operating room solutions. Trilux Medical products and solutions are sold direct in Germany and worldwide through authorized international distributors. More information is available at www.mizuhosi.com


SOURCE Mizuho OSI

Related Links

http://www.mizuhosi.com


rti-surgical-corporate-photos-45-1200x801.jpg

October 26, 2017 OrthoSpineNews

October 26, 2017

ALACHUA, Fla.–(BUSINESS WIRE)–RTI Surgical Inc. (RTI) (Nasdaq: RTIX), a global surgical implant company, today announced that it plans to release financial results from the third quarter 2017 on Thursday, November 2, 2017 prior to the market open.

RTI will host a conference call and simultaneous audio webcast to discuss third quarter results at 8:30 a.m. ET the same day. The conference call can be accessed by dialing (877) 383-7419 (U.S.) or (760) 666-3754 (International). The webcast can be accessed through the investor section of RTI’s website at www.rtix.com. A replay of the conference call will be available on RTI’s website for one month following the call.

About RTI Surgical Inc.

RTI Surgical is a leading global surgical implant company providing surgeons with safe biologic, metal and synthetic implants. Committed to delivering a higher standard, RTI’s implants are used in sports medicine, general surgery, spine, orthopedic, trauma and cardiothoracic procedures and are distributed in nearly 50 countries. RTI is headquartered in Alachua, Fla., and has four manufacturing facilities throughout the U.S. and Europe. RTI is accredited in the U.S. by the American Association of Tissue Banks and is a member of AdvaMed. For more information, please visit www.rtix.com.

Forward Looking Statement

This communication contains forward-looking statements within the meaning of the Private Securities Litigation Reform Act of 1995. These forward-looking statements are based on management’s current expectations, estimates and projections about our industry, our management’s beliefs and certain assumptions made by our management. Words such as “anticipates,” “expects,” “intends,” “plans,” “believes,” “seeks,” “estimates,” variations of such words and similar expressions are intended to identify such forward-looking statements. In addition, except for historical information, any statements made in this communication about anticipated financial results, growth rates, new product introductions, future operational improvements and results or regulatory approvals or changes to agreements with distributors also are forward-looking statements. These statements are not guarantees of future performance and are subject to risks and uncertainties, including the risks described in public filings with the U.S. Securities and Exchange Commission (SEC). Our actual results may differ materially from the anticipated results reflected in these forward-looking statements. Copies of the company’s SEC filings may be obtained by contacting the company or the SEC or by visiting RTI’s website at www.rtix.com or the SEC’s website at www.sec.gov.

Contacts

RTI Surgical Inc.
Jonathon Singer
Chief Financial and Administrative Officer
jsinger@rtix.com
or
Roxane Wergin, 386-418-8888
Director, Corporate Communications
rwergin@rtix.com