Park City, UT

3 days / 6 sessions
Current Issues in Spine

February 2-4, 2017

ext-1.jpeg

November 10, 2017 OrthoSpineNews

WARSAW, Ind., Nov. 08, 2017 (GLOBE NEWSWIRE) — OrthoPediatrics Corp. (“OrthoPediatrics”) (NASDAQ:KIDS), a company exclusively focused on advancing the field of pediatric orthopedics, announced today its financial results for the third quarter ended September 30, 2017.

Third Quarter and Recent Highlights

  • Total revenue of $12.4 million, up 22% as compared to the third quarter of fiscal year 2016
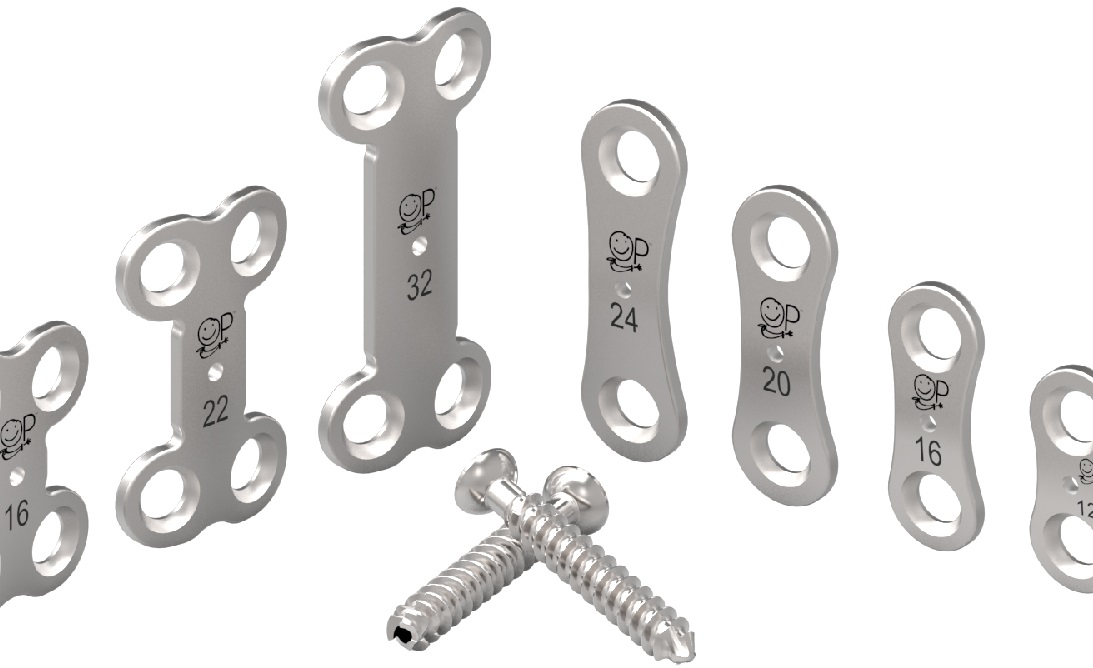
  • Launched PediFrag™ Pediatric Specific Clavicle Plate in August and Medial Patella Femoral Ligament Reconstruction System in October, expanding our product portfolio offering to 22 surgical systems
  • Secured exclusive distribution rights for FIREFLY® Pedicle Screw Navigation Guides in pediatric hospitals in the United States
  • Completed our initial public offering, raising $59.8 million in gross proceeds, primarily to fund commercial expansion
  • Signed a Letter of Intent to amend debt agreement with Squadron Capital LLC, which lowers interest rate and extends term until 2023

“We delivered strong results in the third quarter, highlighted by 22% total revenue growth and the expansion of gross margin to 77%. This included consistent growth in both the U.S. and international markets and across all of our product categories. We were particularly pleased with the performance of our U.S. spine business, which was our fastest growing domestic category this quarter, driven by increased demand for our RESPONSE and BandLoc products,” said Mark Throdahl, Chief Executive Operator of OrthoPediatrics. “We also continued to expand our product portfolio with the launch of two new products and the addition of innovative, 3D printed, patient-specific FIREFLY® Pedicle Screw Navigation Guides, expanding our offering to 22 systems that address the $2.5 billion global market for pediatric orthopedic products. In October, we completed our initial public offering, raising $59.8 million in gross proceeds that will allow us to invest in implant and instrument sets and research and development initiatives to support future growth.”

Third Quarter Financial Results
Total revenue for the third quarter of 2017 was $12.4 million, a 22.1% increase compared to $10.1 million for the same period last year. U.S. revenue for the third quarter of 2017 was $9.6 million, a 21.3% increase compared to $7.9 million for the same period last year, representing 77.2% of total revenue. International revenue for the third quarter of 2017 was $2.8 million, a 24.7% increase compared to $2.3 million for the same period last year, representing 22.8% of total revenue.

Trauma and deformity revenue for the third quarter of 2017 was $8.7 million, a 21.8% increase compared to $7.2 million for the same period last year. Spine revenue for the third quarter of 2017 was $3.3 million, a 20.9% increase compared to $2.7 million for the same period last year. ACL reconstruction/other revenue for the third quarter of 2017 was $0.3 million, a 45.4% increase compared to $0.2 million for the same period last year.

Gross profit for the third quarter of 2017 was $9.5 million, a 32.6% increase compared to $7.2 million for the same period last year. Gross margin percentage for the third quarter of 2017 was 76.7%, compared to 70.6% for the same period last year.

Total operating expenses for the third quarter of 2017 were $10.2 million, a 33.4% increase compared to $7.7 million for the same period last year. Within operating expenses, research and development expenses for the third quarter of 2017 were $1.1 million, a 125.0% increase compared to $0.5 million for the same period last year. Operating loss for the third quarter of 2017 was $(0.8) million, a 44.6% increase in loss realized compared to $(0.5) million for the same period last year.

Interest expense for the third quarter of 2017 was $0.8 million, a 90.7% increase compared to $0.4 million dollars for the same period last year due to incremental debt incurred.

Net loss for the third quarter of 2017 was $(1.5) million, compared to $(0.8) million for the same period last year. Net loss per share attributable to common stockholders for the third quarter of 2017 was $(1.70) per basic and diluted share, or $(1.38) per basic and diluted share, for the same period last year.

The weighted average number of diluted shares outstanding as of September 30, 2017 was 1,773,385 shares.

Purchases of property and equipment during the third quarter of 2017 were $1.1 million, a 34.4% increase compared to $0.8 million for the same period last year. The primary driver of this increase was the deployment of consigned sets, which include product specific instruments as well as cases and trays.

As of September 30, 2017, cash and cash equivalents were $2.2 million, compared to $2.3 million as of June 30, 2017.

Capitalization Update
In October, OrthoPediatrics completed its initial public offering of 4,600,000 shares of its common stock at a public offering price of $13.00 per share, raising $59.8 million in gross proceeds, before underwriting expenses and commissions and offering expenses.

On November 8, 2017, the Company signed a Letter of Intent to amend its current debt agreement with its largest shareholder, Squadron Capital LLC (“Squadron”), to modify and extend the terms of its existing term notes and revolving credit facility. The Letter of Intent consolidates a majority of the term note amounts into a $20.0 million term loan and reestablishes a $15.0 million revolver. Both facilities will have an interest rate equal to the three month LIBOR plus 8.61%, which in total equals 10.0%, compared to a previous interest rate of 10.0% for the term notes and 11.0% for the revolving credit facility. The Letter of Intent extends the loan period through January 31, 2023 (previously May 31, 2019 or May 31, 2020 based on revenue). As of September 30, 2017, the Company had approximately $27.6 million in total outstanding indebtedness, including $7.5 million outstanding under the revolving credit facility, of which the Company expects to convert $1.6 million to term notes plus pay back $2.5 million in the near term, leaving over $11.0 million in available capacity.

Fred Hite, Chief Financial Officer of OrthoPediatrics, commented, “We are pleased to have signed a Letter of Intent to amend our loan agreement with Squadron, which will provide for a more favorable interest rate and extend the length of the agreement. It demonstrates Squadron’s commitment and confidence in our business and its long-term dedication to supporting the Company.”

Conference Call
OrthoPediatrics will host a conference call on Thursday, November 9, 2017 at 8:00 a.m. ET to discuss its financial results. The dial-in numbers are (855) 289-4603 for domestic callers and (614) 999-9389 for international callers. The conference ID number is 9169647. A live webcast of the conference call will be available online at OrthoPediatrics’ investor relations website, ir.orthopediatrics.com.

A replay of the webcast will remain available online at OrthoPediatrics’ investor relations website, ir.orthopediatrics.com, until OrthoPediatrics releases its fourth quarter and full year 2017 financial results. In addition, a telephonic replay of the conference call will be available until November 16, 2017. The replay dial-in numbers are (855) 859-2056 for domestic callers and (404) 537-3406 for international callers. The replay conference ID number is 9169647.

About OrthoPediatrics Corp.
Founded in 2006, OrthoPediatrics is the only diversified orthopedic company focused exclusively on providing a comprehensive product offering to the pediatric orthopedic market. OrthoPediatrics is dedicated to the cause of improving the lives of children with orthopedic conditions. OrthoPediatrics currently markets 22 surgical systems that serve three of the largest categories within the pediatric orthopedic market. This offering spans trauma & deformity, complex spine and ACL reconstruction procedures. OrthoPediatrics’ global sales organization is focused exclusively on pediatric orthopedics and distributes its products in the United States and 35 countries outside the United States.

Investor Contact
The Ruth Group
Zack Kubow
(646) 536-7020
zkubow@theruthgroup.com

ORTHOPEDIATRICS CORP.
CONDENSED CONSOLIDATED BALANCE SHEETS
(Unaudited)
(In Thousands, Except Share Data)
September 30, December 31,
2017 2016
ASSETS
Current assets:
Cash $ 2,238 $ 1,609
Accounts receivable – trade, less allowance for doubtful accounts of $148 and $152, respectively 5,686 4,098
Inventories, net 18,434 13,962
Inventories held by international distributors, net 579 924
Deferred charges 1,339
Prepaid expenses and other current assets 615 233
Total current assets 28,891 20,826
Property and equipment, net 9,749 8,592
Other assets:
Amortizable intangible assets, net 2,183 998
Other intangible assets 260 260
Total other assets 2,443 1,258
Total assets $ 41,083 $ 30,676
LIABILITIES, REDEEMABLE CONVERTIBLE PREFERRED STOCK AND STOCKHOLDERS’ DEFICIT
Current liabilities:
Accounts payable – trade 5,102 3,543
Accrued compensation and benefits 2,288 2,219
Current portion of long-term debt with affiliate 111 107
Other current liabilities 2,915 1,382
Total current liabilities 10,416 7,251
Long-term liabilities:
Long-term debt with affiliate, net of current portion 19,986 12,931
Revolving credit facility with affiliate 7,500 4,500
Total long-term liabilities 27,486 17,431
Total liabilities 37,902 24,682
Commitments and contingencies
Redeemable convertible preferred stock:
Series A preferred stock, $0.00025 par value; $8,874 cumulative preferred dividends, September 30, 2017 and $7,439 December 31, 2016; 1,000,000 shares authorized, issued and outstanding 24,874 23,439
Series B preferred stock, $0.00025 par value; $11,793 cumulative preferred dividends, September 30, 2017 and $8,864 December 31, 2016; 6,000,000 shares authorized; 4,446,978 shares issued and outstanding 50,793 47,864
Stockholders’ deficit:
Common stock, $0.00025 par value; 8,040,000 shares authorized; 2,487,589 shares and 2,421,599 shares issued and outstanding as of September 30, 2017 and December 31, 2016 1 1
Additional paid-in capital 9,541 12,824
Accumulated deficit (82,221 ) (78,134 )
Accumulated other comprehensive income 193
Total stockholders’ deficit (72,486 ) (65,309 )
Total liabilities, redeemable convertible preferred stock and stockholders’ deficit $ 41,083 $ 30,676
ORTHOPEDIATRICS CORP.
CONDENSED CONSOLIDATED STATEMENTS OF OPERATIONS
(Unaudited)
(In Thousands, Except Share and Per Share Data)
Three Months Ended September 30, Nine Months Ended September 30,
2017 2016 2017 2016
Net revenue $ 12,375 $ 10,135 $ 33,939 $ 27,880
Cost of revenue 2,884 2,978 8,321 7,913
Gross profit 9,491 7,157 25,618 19,967
Operating expenses:
Sales and marketing 5,633 4,289 15,122 12,401
General and administrative 3,487 2,890 10,282 8,842
Research and development 1,127 501 2,482 1,599
Total operating expenses 10,247 7,680 27,886 22,842
Operating loss (756 ) (523 ) (2,268 ) (2,875 )
Other expenses:
Interest expense 761 399 1,857 1,056
Other expense (income) 20 (77 ) (38 ) (992 )
Total other expenses 781 322 1,819 64
Net loss $ (1,537 ) $ (845 ) $ (4,087 ) $ (2,939 )
Net loss attributable to common stockholders $ (3,021 ) $ (2,405 ) $ (8,451 ) $ (7,229 )
Weighted average common shares – basic and diluted 1,773,385 1,744,356 1,754,576 1,744,356
Net loss per share attributable to common stockholders – basic and diluted $ (1.70 ) $ (1.38 ) $ (4.82 ) $ (4.14 )
ORTHOPEDIATRICS CORP.
CONDENSED CONSOLIDATED STATEMENTS OF CASH FLOWS
(Unaudited)
(In Thousands)
For the Nine Months Ended
September 30,
2017 2016
OPERATING ACTIVITIES
Net loss $ (4,087 ) $ (2,939 )
Adjustments to reconcile net loss to net cash used in operating activities:
Depreciation and amortization 1,748 1,402
Stock-based compensation 1,081 951
Research and development fee obligation termination (889 )
Changes in certain current assets and liabilities:
Accounts receivable – trade (1,588 ) (74 )
Inventories (3,276 ) (2,834 )
Inventories held by international distributors 345 1,588
Prepaid expenses and other current assets (382 ) (232 )
Accounts payable – trade 1,559 1,798
Accrued expenses and other liabilities 513 (579 )
Research and development fee obligation (628 )
Other 193 0
Net cash used in operating activities (3,894 ) (2,436 )
INVESTING ACTIVITIES
Purchases of licenses (1,337 ) (406 )
Purchases of property and equipment (3,949 ) (2,617 )
Net cash used in investing activities (5,286 ) (3,023 )
FINANCING ACTIVITIES
Proceeds from issuance of debt with affiliate 10,139 3,500
Payments on mortgage notes (80 ) (77 )
Payments of deferred offering costs (250 ) (527 )
Net cash provided by financing activities 9,809 2,896
NET INCREASE (DECREASE) IN CASH 629 (2,563 )
Cash, beginning of year 1,609 3,878
Cash, end of period $ 2,238 $ 1,315
SUPPLEMENTAL DISCLOSURES
Cash paid for interest $ 1,856 $ 1,056
Accretion of redeemable convertible preferred stock $ 4,364 $ 4,290
Transfer of instruments from property and equipment to inventory $ 1,196 $ 196

Net Revenue
The following tables set forth our net revenue by geography and product category for the three and nine months ended September 30, 2017 and 2016:

 Three Months Ended
September 30,
Nine Months Ended
September 30,
Product sales by geographic location: 2017 2016 2017 2016
U.S. $ 9,556 $ 7,875 $ 26,085 $ 21,565
International 2,819 2,260 7,854 6,315
Total $ 12,375 $ 10,135 $ 33,939 $ 27,880
 Three Months Ended
September 30,
Nine Months Ended
September 30,
Product sales by category: 2017 2016 2017 2016
Trauma and deformity $ 8,730 $ 7,168 $ 24,339 $ 20,184
Spine 3,299 2,729 8,652 6,940
ACL reconstruction/other 346 238 948 756
Total $ 12,375 $ 10,135 $ 33,939 $ 27,880

mc-biz-b-braun-knee-joint-lawsuit-20171107.jpg

November 8, 2017 OrthoSpineNews

By Peter Hall of The Morning Call / November 7, 2017

Medical device maker B. Braun concealed from regulators problems with its line of ceramic-coated artificial knees and promoted the products to surgeons despite knowing they were prone to fail, a lawsuit filed in a California court alleges.

The Bethlehem-based company’s Aesculap Implant Systems subsidiary marketed the “advanced surface” ceramic coated knees as superior to standard bare metal implants, claiming they would last longer, the lawsuit says. But the ceramic joints were defective, the suit alleges, because they didn’t adhere properly to cement used to bond them with the patients’ bones.

As a result, the 25 knee replacement patients who are suing B. Braun and Aesculap in a California court were or will be required to undergo additional surgeries to correct problems with the joints or implant different devices, the suit says.

A spokesman for B. Braun, a German company with U.S. headquarters in Bethlehem, did not respond to messages Tuesday.

The lawsuit was filed last month in Los Angeles Superior Court by attorneys Christopher K. Johnston of Guaynabo, Puerto Rico, and Anthony Buzbee of Houston on behalf of the patients, who are from Louisiana, Florida and 10 other states.

According to the lawsuit, Aesculap sought and received permission from the U.S. Food and Drug Administration to sell its advanced surface replacement knees by demonstrating that the devices were as safe and effective as devices that had already been approved. The process is less rigorous than the FDA’s standard medical device approval process, the suit says.


READ THE REST HERE


image-1.jpeg

November 8, 2017 OrthoSpineNews

FARMINGDALE, N.Y.Nov. 7, 2017 /PRNewswire/ — Misonix, Inc. (Nasdaq: MSON), a provider of minimally invasive therapeutic ultrasonic medical devices that enhance clinical outcomes, announced today financial results for the first quarter of fiscal year 2018, ended September 30, 2017.

Financial Highlights for the First Quarter:

  • Revenue for the first quarter of fiscal year 2018 was $7.3 million, an increase of 18% compared with $6.2 million in the previous year’s first quarter.
  • Consumables sales in the United States increased 25% to $4.1 million in the first quarter of the new fiscal year compared to $3.3 million in the comparable quarter of fiscal 2017.
  • The gross profit percentage for the quarter was 70.1% primarily from a strong mix of higher margin consumables, compared to 69.0% in last year’s first quarter.
  • For the first quarter of fiscal year 2018, the Company reported a net loss of $(1.2) million, or $(0.14) per diluted share, compared to a net loss of $(0.5) million, or $(0.07) per diluted share, in the first quarter of fiscal year 2017.
  • At September 30, 2017, the Company maintained cash of $10.5 million with no long-term debt.

Stavros Vizirgianakis, President and Chief Executive Officer of Misonix, said, “Sales orders continued to be strong in the first quarter of fiscal year 2018, with double-digit revenue growth, picking up where we left off in fiscal 2017. Total revenue increased 18% in the first quarter of the new year primarily attributable to a 25% increase in domestic consumables sales. A significant contribution to the increase in domestic sales was made by the addition of new clinical sales specialists to support the sales activities of our distribution channel. The channel, coupled with our team of 28 clinical sales specialists, was successful in driving a 35% increase in BoneScalpel revenue in the U.S. over the prior year. We are making steady progress with the surgical community, and the hospitals where they practice, to further embed our technology in their respective surgical suites.”

“At the recent 32nd Annual Meeting of the North American Spine Society,” Mr. Vizirgianakis continued, “Dr. Wade Jensenof the Center for Neurosciences, Orthopaedics & Spine (“CNOS”) presented data showing a significant reduction in the use of bone grafting material when the Misonix BoneScalpel is employed compared to the use of standard power drill instruments. An estimated $1.9 billion is spent annually on bone graft substitutes. This is valuable data as we are able to show that our products contribute significant value to the overall healthcare system by reducing costs in spinal fusion procedures.”

The Company also recently entered into its most significant license, royalty and manufacturing agreement with Hunan Xing Hang Rui Kang Bio-Technologies Co., Ltd., a Chinese corporation, where Misonix will receive at least $11 million in revenue and royalties over the next four years, and further strengthen its balance sheet.

Conference Call
The Company has scheduled a conference call for Tuesday, November 7, 2017, at 4:30 pm ET to review the results.

Interested parties can access the conference call by dialing (844) 861-5497 or (412) 317-6579 or can listen via a live Internet webcast, which is available in the Investor Relations section of the Company’s website at www.misonix.com.

A teleconference replay of the call will be available for three days at (877) 344-7529 or (412) 317-0088, confirmation # 10113569. A webcast replay will be available in the Investor Relations section of the Company’s website at www.misonix.com for 30 days.

Safe Harbor Statement
With the exception of historical information contained in this press release, content herein may contain “forward looking statements” that are made pursuant to the Safe Harbor Provisions of the Private Securities Litigation Reform Act of 1995. These statements are based on management’s current expectations and are subject to uncertainty and changes in circumstances. Investors are cautioned that forward-looking statements involve risks and uncertainties that could cause actual results to differ materially from the statements made. These factors include general economic conditions, delays and risks associated with the performance of contracts, risks associated with international sales and currency fluctuations, uncertainties as a result of research and development, acceptable results from clinical studies, including publication of results and patient/procedure data with varying levels of statistical relevancy, risks involved in introducing and marketing new products, potential acquisitions, consumer and industry acceptance, litigation and/or court proceedings, including the timing and monetary requirements of such activities, the timing of finding strategic partners and implementing such relationships, regulatory risks including approval of pending and/or contemplated 510(k) filings, the ability to achieve and maintain profitability in the Company’s business lines, the impact of the pending investigation by the Department of Justice and Securities Exchange Commission, and other factors discussed in the Company’s Annual Report on Form 10-K for the fiscal year ended June 30, 2017, subsequent Quarterly Reports on Form 10-Q and Current Reports on Form 8-K. The Company disclaims any obligation to update its forward-looking relationships.

Financial Tables to Follow

MISONIX INC. and Subsidiaries

Consolidated Statements of Operations

(Unaudited)

For the three months ended

September 30,

2017

2016

Net sales

$    7,280,723

$   6,171,625

Cost of goods sold

2,177,355

1,912,007

Gross profit

5,103,368

4,259,618

Operating expenses:

 Selling expenses

3,570,713

3,325,687

 General and administrative expenses

2,573,131

1,931,821

 Research and development expenses

901,274

492,084

Total operating expenses

7,045,118

5,749,592

Loss from operations

(1,941,750)

(1,489,974)

Other income (expense):

 Interest income

13

19

 Royalty income and license fees

452,971

944,068

 Other

(4,458)

(1,996)

Total other income

448,526

942,091

Loss from operations before income taxes

(1,493,224)

(547,883)

Income tax benefit

(281,000)

(26,000)

Net loss

$   (1,212,224)

$    (521,883)

Net loss per share – Basic

$            (0.14)

$          (0.07)

Net loss per share – Diluted

$            (0.14)

$          (0.07)

Weighted average shares – Basic

8,958,405

7,809,385

Weighted average shares – Diluted

8,958,405

7,809,385

MISONIX INC. and Subsidiaries

Consolidated Balance Sheets

September 30,

June 30,

2017

2017

(unaudited)

Assets

Current assets:

Cash and cash equivalents

$    10,528,041

$ 11,557,071

Accounts receivable, less allowance for doubtful accounts of $96,868 and $96,868, respectively

4,153,511

5,133,389

Inventories, net

5,206,025

4,992,434

Prepaid expenses and other current assets

504,653

918,899

Total current assets

20,392,230

22,601,793

Property, plant and equipment, net of accumulated amortization and depreciation of $8,134,134 and $7,794,580, respectively

3,842,419

3,730,203

Patents, net of accumulated amortization of $1,025,930 and $995,568, respectively

715,177

719,136

Goodwill

1,701,094

1,701,094

Intangible and other assets

280,684

282,876

Deferred income tax 

5,524,422

4,334,547

Total assets

$    32,456,026

$ 33,369,649

Liabilities and shareholders’ equity

Current liabilities:

Accounts payable

$      2,106,506

$  1,861,228

Accrued expenses and other current liabilities

1,815,527

3,346,138

Total current liabilities

3,922,033

5,207,366

Deferred lease liability

7,016

9,354

Deferred income

8,989

13,087

Total liabilities

3,938,038

5,229,807

Commitments and contingencies 

Shareholders’ equity:

Common stock, $.01 par value-shares authorized 20,000,000; 9,365,666 and 9,357,166 shares issued and outstanding in each period, respectively

93,657

93,572

Additional paid-in capital

37,490,220

36,808,810

Accumulated deficit

(9,065,889)

(8,762,540)

Total shareholders’ equity

28,517,988

28,139,842

Total liabilities and shareholders’ equity

$    32,456,026

$ 33,369,649

Corporate Contact

Investor Contact

Joe Dwyer

Joe Diaz

Misonix, Inc.

Lytham Partners

631-927-9113

602-889-9700

jdwyer@misonix.com

mson@lythampartners.com


SOURCE Misonix, Inc.

Related Links

http://www.misonix.com


b7cd4bac4d62ecbb662a19c80fac1122-1.png

November 8, 2017 OrthoSpineNews

    Ecully, 7 November 2017

The Board of Directors of Spineway, specialist in surgical implants and instruments for treating disorders of the spinal column (spine), has co-opted Mr. Joseph Brigneaud as an independent Board member.

Joseph Brigneaud, a partner at MAELO Capital – a private-equity investment firm, has over 15 years’ experience in supporting and financing companies. Having opened and headed Euronext’s regional office in Lyon for three years, he has considerable expertise in listed SMEs and mid-cap companies.

As from 23 October 2017, the composition of Spineway’s Board of Directors is as follows:

  • Stéphane Le Roux, Chairman of the Board – Chairman and CEO of Spineway.
  • Philippe Laurito, Board member – Managing Director of Spineway, President of Spineway USA, Inc.
  • Bérangère Boggio, Independent Board member – Director of Legal Affairs and HR at MEDAC since 2013 after seven years with the MYLAN pharmaceutical group.
  • Joseph Brigneaud, Independent Board member.

Stéphane Le Roux, Chairman and CEO of Spineway, said, “We are thrilled to welcome Joseph Brigneaud as a member of our Board of Directors. His perfect understanding of the stock markets and his expertise in growing SMEs will help us increase our development and successfully pursue our geographic expansion.”

SPINEWAY IS ELIGIBLE FOR THE PEA-PME

SPINEWAY will be attending the SFAF Mid-Caps conference on 14 November 2017

Spineway designs, manufactures and markets innovative implants and surgical instruments for treating severe disorders of the spinal column.
Spineway has an international network of over 50 independent distributors and 90% of its turnover comes from exports.
Spineway, which is eligible for investment through FCPIs (French unit trusts specializing in innovation), received the OSEO Excellence award as well as the Deloitte Fast 50 award in 2011. Rhône Alpes INPI Patent Innovation Award (2013) – Talent INPI award (2015). 
ISIN code: FR0011398874 – Euronext Growth

This press release is entered into in both English and French languages. In case of discrepancies, French language shall prevail.

Contacts:           

Investor Relations
David Siegrist – Finance Director
+33 (0)4 72 77 01 52
finance.dsg@spineway.com


Financial Communication
Jérôme Gacoin / Solène Kennis
+33 (0)1 75 77 54 68
skennis@aelium.fr

Attachments:

http://www.globenewswire.com/NewsRoom/AttachmentNg/cba803a0-08bf-446d-b4fd-a2179bf35d7


0d88750.png

November 7, 2017 OrthoSpineNews

CENTENNIAL, Colo.Nov. 7, 2017 /PRNewswire-USNewswire/ — AlloSource, one of the nation’s largest providers of cartilage, bone, skin, soft-tissue and cellular allografts for use in surgical procedures and wound care to advance patient healing, today announced the appointment of Bob Lay as Chief Operating Officer.

With over 20 years of experience in both finance and operations, Bob has a broad-based understanding of how each department within an organization impacts another. He has an extensive background working with businesses and medical device companies to conduct operational audits, improve processes and systems, and balance the needs of many departments to drive company growth and success.

“The Chief Operating Officer role at AlloSource is critical to creating the cellular and tissue products surgeons need to help restore mobility in more patients,” said Thomas Cycyota, AlloSource President and Chief Executive Officer. “Bob’s background, as well as his open-minded approach to driving improvements, will help us identify new opportunities to advance the work we do.”

In addition to his role as Chief Operating Officer, Bob also served AlloSource as the Director of Cost Accounting and Vice President, Operations. Prior to his time at AlloSource, he held leadership roles at both startups and large companies. Bob received his Bachelor’s and Master’s degrees in Accounting from the University of Denver.

“I am honored to lead the dedicated and passionate Operations team at AlloSource,” said Lay. “AlloSource’s commitment to donors and patients inspires me every day, and I look forward to contributing to the organization’s continued growth.”

About AlloSource
AlloSource is one of the largest nonprofit cellular and tissue networks in the country, offering more than 200 types of precise cartilage, cellular, bone, skin and soft-tissue allografts to advance patient healing. For more than 20 years, AlloSource’s products have bridged the proven science of allografts with the advanced technology of cells, offering life-saving and life-enhancing possibilities in spine, sports medicine, foot and ankle, orthopedic, reconstructive, trauma and wound care procedures. As the world’s largest processor of cellular bone allografts, fresh cartilage tissue for joint repair and skin allografts to help patients heal from severe burns, AlloSource delivers unparalleled expertise and service to its growing network of surgeons, partners, and the country’s most reputable organ procurement organizations. The company is accredited by the American Association of Tissue Banks and is headquartered in Centennial, CO. For more information, please visit allosource.org or our educational website, allograftpossibilities.org.

Media Contact
Megan Duggan
AlloSource
720. 382. 2766
mduggan@allosource.org


SOURCE AlloSource


mazor-robotics-7x4-1.jpg

November 7, 2017 OrthoSpineNews

November 07, 2017

CAESAREA, Israel–(BUSINESS WIRE)–Mazor Robotics Ltd. (TASE: MZOR; NASDAQGM: MZOR), a pioneer and a leader in the field of robotic guidance systems, reported record third quarter revenue of $17.2 million. As previously announced, the Company received purchase orders for 22 systems in the 2017 third quarter, including 19 Mazor X systems.

Recent Significant Highlights

  • Entered the next phase of its strategic partnership with Medtronic assuming exclusive worldwide distribution of the Mazor X system, and Medtronic making a $40 million third tranche investment in Mazor. On November 1, Mazor and Medtronic completed the transfer of Mazor X capital sales, clinical sales and support activities to Medtronic and the absorption of 29 former Mazor employees into the Medtronic robotic sales team.
  • Received CE approval of the Mazor X system, allowing Medtronic to market the Mazor X in the European Union, as well as other countries that recognize the CE Mark.
  • Interim data from the first multi-center prospective study of spinal surgical robotics was presented at the North American Spine Society (NASS) annual meeting, demonstrating that spinal surgeries performed using Mazor Robotics’ proprietary Mazor Core™ technology have a five-fold reduction in surgical complications and a seven-fold reduction in revision surgeries, compared to freehand-based minimally invasive lumbar fusion surgeries.

“We delivered record quarterly revenue and more than doubled last year’s Q3 results,” commented Ori Hadomi, Chief Executive Officer. “Our performance demonstrates that we are executing our objectives to drive market penetration and increased utilization of our systems. We entered the next phase with Medtronic, our commercial partner, for the Mazor X system and the smooth transition ensures continued sales momentum while significantly lowering our operating costs beginning Q4 2017. In addition to the operational achievements, the recent prospective data results that were presented at NASS are a game changer for Mazor as it validates the strength of our proprietary Mazor Core ™ technology and reinforces the patient value and economic proposition of our systems.”

THIRD QUARTER 2017 FINANCIAL RESULTS ON IFRS BASIS (“GAAP”)

Revenue for the three months ended September 30, 2017 increased 126% to $17.2 million compared to $7.6 million in the year-ago third quarter. U.S. revenue increased 170% to $15.4 million compared to $5.7 million in the year-ago third quarter, as the Company recognized revenue from 17 systems (16 Mazor X and one Renaissance) compared to six systems (three Mazor X and three Renaissance) in the third quarter of 2016. International revenue was $1.8 million compared to $1.9 million in the year-ago third quarter. Recurring revenue from kits sales, services and other increased 63% to $7.0 million in the third quarter of 2017 compared to $4.3 million in the year-ago third quarter, which is primarily attributed to the higher system installed base. The Company ended the quarter with a backlog of 17 systems (15 Mazor X and two Renaissance). As of September 18, 2017, Medtronic assumed exclusive worldwide distribution of the Mazor X under the Exclusive Lead Sharing and Distribution Agreement signed between the parties. The contracted pricing with Medtronic is at a lower rate than Mazor realized through its direct sales channel.

The Company’s gross margin for the three months ended September 30, 2017 was 69.2% compared to 65.7% in the year-ago third quarter. Total operating expenses were $15.7 million compared to $10.6 million in the year-ago third quarter primarily reflecting the Company’s increased investment in sales and marketing activities. The Company’s sales and marketing expenses are now expected to decrease as Medtronic assumed commercial responsibility for the Mazor X, effective September 18, 2017. Operating loss was $3.8 million compared to an operating loss of $5.6 million in the year-ago third quarter. Net loss for the third quarter of 2017 was $3.7 million, or $0.07 per share, compared to a net loss of $5.2 million, or $0.11 per share, for the year-ago third quarter.

Cash used in operating activities during the 2017 third quarter was $2.9 million compared to $4.6 million used in operating activities in the year-ago third quarter. The lower cash use is due to the significantly higher revenue in the 2017 third quarter. As of September 30, 2017, cash, cash equivalents and investments totaled $98.8 million.

THIRD QUARTER 2017 FINANCIAL RESULTS ON NON-GAAP BASIS

The tables below include reconciliation of the Company’s GAAP results to non-GAAP results. The reconciliation relates to non-cash expenses in the amount of $2.6 million with respect to share-based payments and amortization of intangible assets recorded in the third quarter of 2017. On a non-GAAP basis, the net loss in the third quarter of 2017 was $1.0 million, or $0.02 per share, compared to $4.9 million, or $0.11 per share, for the year-ago third quarter.

NINE MONTHS ENDED SEPTEMBER 30, 2017 FINANCIAL RESULTS ON IFRS BASIS (“GAAP”)

For the nine months ended September 30, 2017, revenue increased 99% and totaled $44.4 million compared to $22.3 million for the nine months ended September 30, 2016, due to higher system sales and an increase in recurring revenue. Recurring revenue totaled $18.5 million, an increase of 50% compared to $12.3 million in the nine months ended September 30, 2016. The growth in recurring revenue is attributed to the increase in the installed base and high utilization of the Company’s robotic guidance systems, both in the U.S. and globally. Gross margin for the nine months ended September 30, 2017 was 68.0% compared with 72.3% in the nine months ended September 30, 2016. This expected decrease is attributed mainly to the higher manufacturing costs of the Mazor X compared to the Renaissance system. Net loss for the nine months ended September 30, 2017 was $12.6 million, or $0.26 per share, compared to a net loss of $14.4 million, or $0.33 per share, in the first nine months of 2016.

NINE MONTHS ENDED SEPTEMBER 30, 2017 FINANCIAL RESULTS ON NON-GAAP BASIS

On a non-GAAP basis, the net loss for the first nine months of 2017 was $7.3 million, or $0.15 per share, compared to a net loss of $12.9 million, or $0.29 per share, in the first nine months of 2016.

CONFERENCE CALL INFORMATION

The Company will host a conference call to discuss its third quarter financial results as well as recent corporate developments on November 7, 2017 at 8:30 AM EST (3:30 PM IST). Investors within the United States interested in participating are invited to call 800-298-0498. Participants in Israel can use the toll-free dial-in number 1-80-924-6042. All other international participants can use the dial-in number 719-457-2654. For all callers, refer to Conference ID 5718138.

A replay of the event will be available for two weeks following the conclusion of the call. To access the replay, callers in the United States can call 1-866-375-1919 and reference the Replay Access Code: 5718138. All international callers can dial +1 719-457-0820, using the same Replay Access Code. To access the webcast, please visit www.mazorrobotics.com and select ‘Investor Relations.’

Use of Non-GAAP Measures

In addition to disclosing financial results calculated in accordance with generally accepted accounting principles in conformity with International Financial Reporting Standards (GAAP), this press release contains Non-GAAP financial measures for gross profit, operating expenses, operating loss, net loss and basic and diluted earnings per share that exclude the effects of capitalization of development costs, non-cash expense of amortization of intangible assets and share-based payments. Management believes that these non-GAAP financial measures provide meaningful supplemental information regarding the Company’s performance that enhances management’s and investors’ ability to evaluate the Company’s net income and earnings per share and to compare them to historical net income and earnings per share.

The presentation of this non-GAAP financial information is not intended to be considered in isolation or as a substitute for the financial information prepared and presented in accordance with GAAP. Management uses both GAAP and non-GAAP measures when operating and evaluating the Company’s business internally and therefore decided to make these non-GAAP adjustments available to investors.

About Mazor

Mazor Robotics (TASE: MZOR; NASDAQGM: MZOR) believes in healing through innovation by developing and introducing revolutionary technologies and products aimed at redefining the gold standard of quality care. Mazor Robotics Guidance System enables surgeons to conduct spine and brain procedures in an accurate and secure manner. For more information, please visit www.MazorRobotics.com.

Forward-Looking Statements

This press release contains forward-looking statements within the meaning of the Private Securities Litigation Reform Act of 1995 and other securities laws. Any statements in this release about future expectations, plans or prospects for the Company, including without limitation, statements regarding continued sales momentum and significantly lower operating costs beginning Q4 2017, the recent prospective data results presented at NASS being a game changer for the Company, the expected decrease in sales and marketing expenses, and other statements containing the words “believes,” “anticipates,” “plans,” “expects,” “will” and similar expressions are forward-looking statements. These statements are only predictions based on Mazor’s current expectations and projections about future events. There are important factors that could cause Mazor’s actual results, level of activity, performance or achievements to differ materially from the results, level of activity, performance or achievements expressed or implied by the forward-looking statements. Those factors include, but are not limited to, the impact of general economic conditions, competitive products, product demand and market acceptance risks, reliance on key strategic alliances, fluctuations in operating results, and other factors indicated in Mazor’s filings with the Securities and Exchange Commission (SEC) including those discussed under the heading “Risk Factors” in Mazor’s annual report on Form 20-F filed with the SEC on May 1, 2017 and in subsequent filings with the SEC. For more details, refer to Mazor’s SEC filings. Mazor undertakes no obligation to update forward-looking statements to reflect subsequent occurring events or circumstances, or to changes in our expectations, except as may be required by law

Mazor Robotics Ltd.
CONSOLIDATED STATEMENT OF PROFIT OR LOSS
(in thousands, except per share data)
(UNAUDITED)
Nine month period Three month period
ended September 30, ended September 30,
2017 2016 2017 2016
Revenue $ 44,378 $ 22,336 $ 17,204 $ 7,633
Cost of revenue $ 14,180 $ 6,182 $ 5,305 $ 2,616
Gross profit $ 30,198 $ 16,154 $ 11,899 $ 5,017
Operating expenses:
Research and development, net $ 5,692 $ 4,027 $ 1,658 $ 785
Selling and marketing, net $ 32,638 $ 22,781 $ 12,429 $ 8,125
General and administrative $ 5,310 $ 4,072 $ 1,653 $ 1,660
Total operating cost and expenses $ 43,640 $ 30,880 $ 15,740 $ 10,570
Loss from operations $ (13,442) $ (14,726) $ (3,841) $ (5,553)
Financing income, net $ 631 $ 345 $ 188 $ 142
Loss before taxes on income $ (12,811) $ (14,381) $ (3,653) $ (5,411)
Income tax expense (benefit) $ (250) $ 21 $ $ (188)
Net loss $ (12,561) $ (14,402) $ (3,653) $ (5,223)
Net loss per share – Basic and diluted $ (0.26) $ (0.33) $ (0.07) $ (0.11)
Weighted average common shares outstanding – Basic and diluted 48,334 43,981 49,011 46,159
Mazor Robotics Ltd.
CONSOLIDATED STATEMENTS OF FINANCIAL POSITION AS OF
(U.S. Dollars in thousands)
September 30, December 31,
2017 2016
(Unaudited) (Audited)
Current assets
Cash and cash equivalents $ 49,028 $ 14,954
Short-term investments 44,280 37,862
Trade receivables 6,185 8,225
Other current assets 2,011 1,728
Inventory 8,382 4,715
Total current assets 109,886 67,484
Non-current assets
Long-term investments 5,471 9,017
Property and equipment, net 4,146 3,615
Intangible assets, net 2,009 2,258
Other non-current assets 989 351
Total non-current assets 12,615 15,241
Total assets $ 122,501 $ 82,725
Current liabilities
Trade payables $ 1,654 $ 5,018
Deferred revenue 3,717 4,031
Other current liabilities 10,740 8,462
Total current liabilities 16,111 17,511
Non-current liabilities
Employee benefits 448 325
Total non-current liabilities 448 325
Total liabilities 16,559 17,836
Equity
Share capital 134 124
Share premium 217,145 174,647
Amounts allocated to warrants 9,629
Capital reserve for share-based payment transactions 11,336 9,859
Foreign currency translation reserve 2,119 2,119
Accumulated loss (134,421) (121,860)
Total equity 105,942 64,889
Total liabilities and equity $ 122,501 $ 82,725
Mazor Robotics Ltd.
CONSOLIDATED CASH FLOW STATEMENTS
(U.S. Dollars in thousands)
(UNAUDITED)
Nine months ended Three months ended
September 30, September 30,
2017 2016 2017 2016
Cash flows from operating activities:
Loss for the period $ (12,561) $ (14,402) $ (3,653) $ (5,223)
Adjustments:
Depreciation and amortization $ 1,107 $ 476 $ 393 $ 180
Gain on sale of property and equipment $ $ (6) $ $ (6)
Finance income, net $ (328) $ (313) $ (209) $ (140)
Share-based expenses $ 4,975 $ 3,378 $ 2,553 $ 1,244
Income tax expense (tax benefit) $ (250) $ 21 $ $ (188)
$ 5,504 $ 3,556 $ 2,737 $ 1,090
Change in inventory $ (3,967) $ (1,288) $ (1,017) $ (557)
Change in trade and other accounts receivable $ 1,774 $ 2,076 $ 514 $ (301)
Change in prepaid lease fees $ (30) $ (18) $ (8) $ (14)
Change in trade and other accounts payable $ (940) $ 1,635 $ (1,732) $ 302
Change in employee benefits $ 123 $ 39 $ (13) $ (29)
$ (3,040) $ 2,444 $ (2,256) $ (599)
Interest received $ 432 $ 235 $ 249 $ 98
Income tax paid $ (15) $ (38) $ $ 1
$ 417 $ 197 $ 249 $ 99
Net cash used in operating activities $ (9,680) $ (8,205) $ (2,923) $ (4,633)
Cash flows from investing activities:
Proceeds from (investment in) short-term investments and deposits, net $ 1,416 $ (11,617) $ (9,019) $ (9,240)
Purchase of long-term investments $ (4,288) $ (8,906) $ (3,665) $ (7,781)
Proceeds in long-term investments $ $ 498 $ $ 498
Purchase of property and equipment $ (1,557) $ (1,735) $ (244) $ (628)
Capitalization of development costs $ $ (1,517) $ $ (920)
Net cash used in investing activities $ (4,429) $ (23,277) $ (12,928) $ (18,071)
Cash flows from financing activities:
Proceeds from issuance of ADRs, net $ 40,000 $ 31,416 $ 40,000 $ 19,521
Proceeds from exercise of share options by employees $ 8,293 $ 3,587 $ 4,574 $ 3,464
Proceeds from exercise of share options and warrants, net $ $ 481 $ $
Net cash provided by financing activities $ 48,293 $ 35,484 $ 44,574 $ 22,985
Net increase in cash and cash equivalents $ 34,184 $ 4,002 $ 28,723 $ 281
Cash and cash equivalents at the beginning of the period $ 14,954 $ 13,519 $ 20,347 $ 17,277
Effect of exchange rate differences on balances of cash and cash equivalents $ (110) $ 76 $ (42) $ 39
Cash and cash equivalents at the end of the period $ 49,028 $ 17,597 $ 49,028 $ 17,597
Supplementary cash flows information:
Purchase of property and equipment in credit $ (96) $ (68) $ (96) $ (68)
Issuance costs in credit $ (22) $ (385) $ (22) $ (385)
Capitalization of development expenses on credit $ $ (20) $ $ (20)
Classification of inventory to fixed assets $ 300 $ $ 300 $
Mazor Robotics Ltd.
RECONCILIATIONS OF GAAP TO NON-GAAP FINANCIAL MEASURES
(U.S. Dollars in thousands, except per share data)
(UNAUDITED)
Nine month period Three month period
ended September 30, ended September 30,
2017 2016 2017 2016
GAAP gross profit $ 30,198 $ 16,154 $ 11,899 $ 5,017
Amortization of intangible assets 250 85
Share-based payments 248 170 140 87
Non-GAAP gross profit $ 30,696 $ 16,324 $ 12,124 $ 5,104
GAAP gross profit as percentage of revenues 68.0% 72.3% 69.2% 65.7%
Non-GAAP gross profit as percentage of revenues 69.2% 73.1% 70.5% 66.9%
GAAP operating expenses $ 43,640 $ 30,880 $ 15,740 $ 10,570
Share-based payments:
Research and development $ 641 $ 695 $ 289 $ 348
Selling and marketing $ 2,363 $ 1,972 $ 1,512 $ 757
General and administrative $ 1,723 $ 971 $ 612 $ 482
Development costs capitalization $ $ (2,332) $ $ (1,321)
Non-GAAP operating expenses $ 38,913 $ 29,574 $ 13,327 $ 10,304
GAAP operating loss $ (13,442) $ (14,726) $ (3,841) $ (5,553)
Non-GAAP operating loss $ (8,217) $ (13,250) $ (1,203) $ (5,200)
GAAP net loss $ (12,561) $ (14,402) $ (3653) $ (5,223)
Amortization of intangible assets $ 250 $ $ 85 $
Share-based payments $ 4,975 $ 3,808 $ 2,553 $ 1,674
Development costs capitalization $ $ (2,332) $ $ (1,321)
Non-GAAP net loss $ (7,336) $ (12,926) $ (1,015) $ (4,870)
GAAP basic and diluted loss per share $ (0.26) $ (0.33) $ (0.07) $ (0.11)
Non-GAAP basic and diluted loss per share $ (0.15) $ (0.29) $ (0.02) $ (0.11)

Contacts

EVC Group
Investors
Michael Polyviou, 212-850-6020
mpolyviou@evcgroup.com
or
Doug Sherk, 646-445-4800
dsherk@evcgroup.com


amedica-corporation-building-1-1200x800.jpg

November 6, 2017 OrthoSpineNews

SALT LAKE CITY, Nov. 06, 2017 (GLOBE NEWSWIRE) — Amedica Corporation (Nasdaq:AMDA), an innovative biomaterial company that develops and manufactures silicon nitride as a platform for biomedical applications, announced that the company made a 510(k) submission to the U.S Food and Drug Administration for its  Valeo C+CSC with Lumen spinal implant.

The Valeo C+CSC with Lumen is a modified CSC (cancellous structured ceramic) that is similar to Amedica’s commercially available Valeo C and Valeo C+ CSC (cleared in Europe only) cervical implants. This device increases implant surface area and plays an active role in the spinal fusion process while maintaining the other benefits silicon nitride brings to patients and physicians.

“The Valeo C+CSC with Lumen submission is a key step in introducing our proprietary porous silicon nitride technology into the US market. We look forward to working with the FDA on this important company milestone,” said Dr. Sonny Bal, Amedica CEO

About Amedica Corporation

Amedica is focused on the development and application of spinal interbody implants made with medical-grade silicon nitride ceramic. Amedica markets spinal fusion products and is developing implants for other biomedical applications, such as wear- and corrosion-resistant hip and knee bearings, and dental implants. The Company’s products are manufactured in its ISO 13485 certified manufacturing facility, and it has a partnership with Kyocera, one of the world’s largest ceramic manufacturers. Amedica’s FDA-cleared and CE-marked spine products are currently marketed in the U.S. and select markets in Europe and South America through its distributor network, and OEM and private label partnerships.

For more information on Amedica or its silicon nitride material platform, please visit www.amedica.com.

Forward-Looking Statements

This press release contains statements that constitute forward-looking statements within the meaning of the Securities Act of 1933 and the Securities Exchange Act of 1934, as amended by the Private Securities Litigation Reform Act of 1995. Such statements are subject to risks and uncertainties that could cause actual results to differ materially from those contemplated within this press release. A discussion of those risks and uncertainties can be found in Amedica’s Risk Factors disclosure in its Annual Report on Form 10-K, filed with the Securities and Exchange Commission (SEC) on September 20, 2017, and in Amedica’s other filings with the SEC. Amedica disclaims any obligation to update any forward-looking statements.

Contacts:
Amedica IR
801-839-3502
IR@amedica.com

Pediplates-2.jpg

November 6, 2017 OrthoSpineNews

Shanthi Rexaline , Benzinga Staff Writer /November 6, 2017

Orthopediatrics Corp KIDS 4.9% is poised to achieve strong top-line growth due to its exclusive focus on the sizeable and largely underserved $2.5 billion pediatric orthopedic market, according to Stifel.

Stifel initiated coverage of Orthopediatrics with a Buy rating and a $23 price target for the shares. The valuation represents a 5.5 times enterprise value to revenue multiple, applied to Stifel’s 2019 revenue estimate for Orthopediatrics of $63.6 billion and discounted 10 percent to the end of 2018.

The pediatric orthopedic market, including trauma and deformity, complex spine and sports medicine, offers the most comprehensive and still-expanding portfolio of pediatric orthopedic implants and instruments to treat a wide array of orthopedic conditions, said analyst Rick Wise.

Capitalizing on this opportunity, Wise said the firm can deliver top-line CAGR in the solid high teens, suggesting revenues that would icrease from an estimated $45 million this year to $98.5 million in 2022. This would put Orthopediatrics above the average revenue growth among its peers.


READ THE REST HERE


1463453173233864-1200x900.jpg

November 6, 2017 OrthoSpineNews

NOVEMBER 3, 2017/ BY 

Hologic (NSDQ:HOLX) said this week its current prez and CEO Stephen MacMillan will stay on with the company, resolving rumors that he may depart it to take up the corner office at Zimmer Biomet (NYSE:ZBH).

In an SEC filing, the Marlborough, Mass.-based company’s board said it approved a special “performance-based retention equity grant” to MacMillan after he had begun to receive interest from other medical device firms.

“Mr. MacMillan has led a dramatic turnaround of Hologic since joining in December 2013. The company’s performance has increased significantly under his leadership and he personally has recruited a large number of leaders to the company. In light of his long track record of success, other larger medical device companies have expressed interest over time in retaining him to serve as chief executive officer. Mr. MacMillan recently received such an offer from a large medical device company. The independent members of the company’s board of directors considered the potential for disruption to Hologic and its business should Mr. MacMillan leave, and determined that it was in the best interests of Hologic and its stockholders to retain him as chairman, president and chief executive officer. Accordingly, the independent members of the board, after careful consideration and discussions with Mr. MacMillan and the compensation committee’s compensation consultant, awarded him a special retention equity grant, all of which is performance-based. He has formally declined the other more substantial offer, reaffirmed his full commitment to Hologic, and will remain as chairman, president and chief executive officer of Hologic,” the company wrote in an SEC filing.


READ THE REST HERE


dermapace-029-1200xx4992-2808-0-260-e1509991162704.jpg

November 6, 2017 OrthoSpineNews

SUWANEE, GA–(Marketwired – Nov 3, 2017) – SANUWAVE Health, Inc. (OTCQB: SNWV) is pleased to announce that the company will exhibit at Wounds Canada 2017 Fall Conference in Mississauga, Ontario on 16 – 19 November 2017. SANUWAVE cordially invites you to our booth number 111. Wounds Canada’s fall conference is a continuing education event designed to support healthcare professionals who work with patients with wounds or who are at risk for developing wounds. SANUWAVE is using this occasion to introduce and educate on our lead wound care product, dermaPACE®.

In Canada, 2.4 million people were living with diabetes in 2008-2009, a figure that is expected to rise to close to 4 million people by 2018-2019. Ulceration of the foot is one of the major health problems with diabetes, diabetic foot ulcers in acute inpatient care is a serious chronic disease, and is a major factor in the story of wounds. Wounds Canada, formerly Canadian Association of Wound Care, estimates that the average cost of treating a chronic wound in Canada is $10K and diabetes related ulcers cost the Canadian health care system $150M annually. Early treatment intervention with dermaPACE can prevent ulcers from developing complications such as infection that could lead to amputation.

“We are very excited about growing our activities in Canada in the wound care arena,” stated Mr. Richardson, Chief Executive Officer of SANUWAVE. “Our exhibition will be the springboard to establish and then grow our market presence in Canada.”

About SANUWAVE Health, Inc. 
SANUWAVE Health, Inc. (OTCQB: SNWV) (www.sanuwave.com) is a shock wave technology company initially focused on the development and commercialization of patented noninvasive, biological response activating devices for the repair and regeneration of skin, musculoskeletal tissue and vascular structures. SANUWAVE’s portfolio of regenerative medicine products and product candidates activate biologic signaling and angiogenic responses, producing new vascularization and microcirculatory improvement, which helps restore the body’s normal healing processes and regeneration. SANUWAVE applies its patented PACE technology in wound healing, orthopedic/spine, plastic/cosmetic and cardiac conditions. Its lead product candidate for the global wound care market, dermaPACE, is CE Marked throughout Europe and has device license approval for the treatment of the skin and subcutaneous soft tissue in Canada, Australia and New Zealand. In the U.S., dermaPACE is currently under the FDA’s de novo petition review process for the treatment of diabetic foot ulcers. SANUWAVE researches, designs, manufactures, markets and services its products worldwide, and believes it has demonstrated that its technology is safe and effective in stimulating healing in chronic conditions of the foot (plantar fasciitis) and the elbow (lateral epicondylitis) through its U.S. Class III PMA approved OssaTron® device, as well as stimulating bone and chronic tendonitis regeneration in the musculoskeletal environment through the utilization of its OssaTron, Evotron® and orthoPACE® devices in Europe, Asia and Asia/Pacific. In addition, there are license/partnership opportunities for SANUWAVE’s shock wave technology for non-medical uses, including energy, water, food and industrial markets.

Forward-Looking Statements
This press release may contain “forward-looking statements” within the meaning of the Private Securities Litigation Reform Act of 1995, such as statements relating to financial results and plans for future business development activities, and are thus prospective. Forward-looking statements include all statements that are not statements of historical fact regarding intent, belief or current expectations of the Company, its directors or its officers. Investors are cautioned that any such forward-looking statements are not guarantees of future performance and involve risks and uncertainties, many of which are beyond the Company’s ability to control. Actual results may differ materially from those projected in the forward-looking statements. Among the key risks, assumptions and factors that may affect operating results, performance and financial condition are risks associated with the regulatory approval and marketing of the Company’s product candidates and products, unproven pre-clinical and clinical development activities, regulatory oversight, the Company’s ability to manage its capital resource issues, competition, and the other factors discussed in detail in the Company’s periodic filings with the Securities and Exchange Commission. The Company undertakes no obligation to update any forward-looking statement.

For additional information about the Company, visit www.sanuwave.com.

CONTACT INFORMATION

  • Millennium Park Capital LLC
    Christopher Wynne
    312-724-7845
    cwynne@mparkcm.com

    SANUWAVE Health, Inc.
    Andre Mouton
    Vice President International Sales and Relations
    +1-615-823-9907 (Cell)
    +1-678-569-0881 (Fax)
    Skype: andre.w.mouton
    Andre.Mouton@sanuwave.com