Park City, UT

3 days / 6 sessions
Current Issues in Spine

February 2-4, 2017

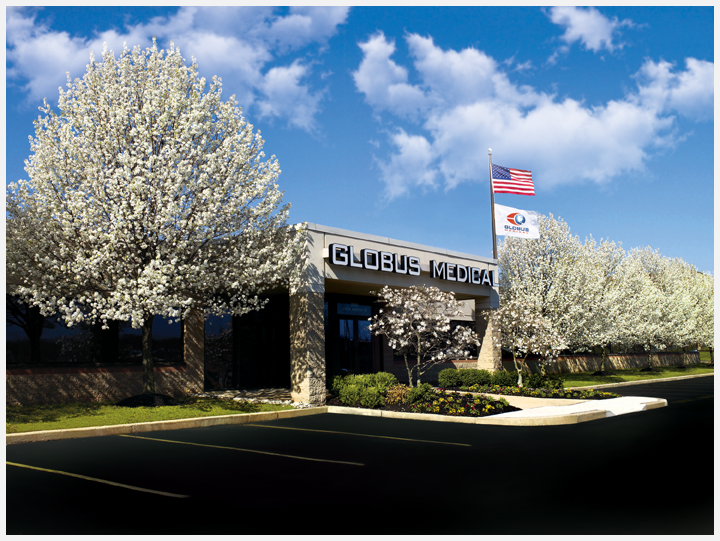
globus-medical-1.png

August 1, 2018 OrthoSpineNews

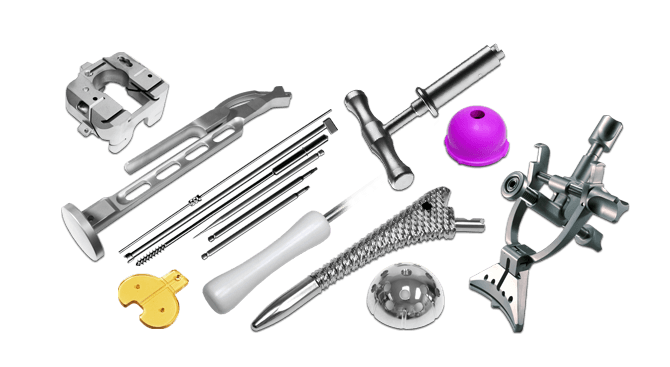
AUDUBON, Pa., Aug. 01, 2018 (GLOBE NEWSWIRE) — Globus Medical, Inc. (NYSE:GMED), a leading musculoskeletal solutions company, today announced its financial results for the second quarter ended June 30, 2018.

  • Worldwide sales were $173.4 million, an increase of 13.8% as reported
  • Second quarter net income was $45.0 million, an increase of 56.9%
  • Diluted earnings per share (EPS) and non-GAAP EPS were $0.44
  • Non-GAAP EPS increased 38.0% compared to second quarter of 2017
  • Non-GAAP adjusted EBITDA was 34.3% of sales

“The second quarter marks the third consecutive quarter of double-digit organic growth for Globus Medical, as our U.S. Spine business continues to take market share, growing by 4.2%; our international revenue increased by 7.2%; and Emerging Technologies contributed $13.8 million,” said Dave Demski, CEO.  “We are very pleased with the strong sales of our ExcelsiusGPS™ robotic system, and more importantly, the level of adoption we are seeing by surgeons in accounts that have purchased the technology.  The synergy of this transformational technology, combined with the most innovative suite of spinal implants in the industry, is expected to provide a powerful platform for our future growth.”

Worldwide sales for the second quarter were $173.4 million, an increase of 13.8% over the second quarter of 2017.  Non-GAAP diluted EPS was $0.44, an increase of 38.0%.  Revenue from Emerging Technologies was primarily due to continued demand for our ExcelsiusGPS™ robotics and navigation system.

Second quarter sales in the U.S., including robotics, increased by 15.1% compared to the second quarter of 2017.  International sales increased by 7.2% over the second quarter of 2017 on an as-reported basis and 4.3% on a constant currency basis.

Second quarter GAAP net income was $45.0 million, an increase of 56.9% over the same period last year.  Diluted EPS for the second quarter was $0.44, as compared to $0.29 for the second quarter 2017.  Non-GAAP diluted EPS for the second quarter was $0.44, compared to $0.32 in the second quarter of 2017.

The company generated net cash provided by operating activities of $33.3 million and non-GAAP free cash flow of $18.5 million in the second quarter, and ended the quarter with cash, cash equivalents and marketable securities of $516.8 million.  The company remains debt free.

2018 Annual Guidance
The company today issued new guidance for full year 2018 sales of $700 million and non-GAAP fully diluted earnings per share of $1.55.  2018 guidance was previously sales of $695 million and non-GAAP fully diluted earnings per share of $1.52.

Executive Appointment
The company also announced the promotion of Dan Scavilla to the position of Executive Vice President, Chief Commercial Officer.  In his new role, Mr. Scavilla will be responsible for all contracting and pricing; supply chain and logistics; and manufacturing operations; as well as continued oversight of all finance-related functions.  Mr. Scavilla will continue in the role of Chief Financial Officer until the company completes its search for a new CFO.

Conference Call Information
Globus Medical will hold a teleconference to discuss its 2018 second quarter results with the investment community at 4:30 p.m. Eastern Time today.  Globus invites all interested parties to join the call by dialing:

1-855-533-7141          United States Participants
1-720-545-0060          International Participants
There is no pass code for the teleconference.

For interested parties who do not wish to ask questions, the teleconference will be webcast live and may be accessed through a link on the Globus Medical website at investors.globusmedical.com.

The call will be archived until Wednesday, August 8, 2018.  The audio archive can be accessed by calling 1-855-859-2056 in the U.S. or 1-404-537-3406 from outside the U.S. The passcode for the audio replay is 1012-6350.

About Globus Medical, Inc.
Based in Audubon, Pennsylvania, Globus Medical, Inc. was founded in 2003 by an experienced team of professionals with a shared vision to create products that enable surgeons to promote healing in patients with musculoskeletal disorders. Additional information can be accessed at www.globusmedical.com.

Non-GAAP Financial Measures

To supplement our financial statements prepared in accordance with U.S. generally accepted accounting principles (“U.S. GAAP”), management uses certain non-GAAP financial measures.  For example, non-GAAP adjusted EBITDA, which represents net income before interest income, net and other non-operating expenses, provision for income taxes, depreciation and amortization, stock-based compensation, provisions for litigation, technology in-licensing fee, and acquisition related costs, and net gain from the sale of assets, is useful as an additional measure of operating performance, and particularly as a measure of comparative operating performance from period to period, as it is reflective of changes in pricing decisions, cost controls and other factors that affect operating performance, and it removes the effect of our capital structure, asset base, income taxes and interest income and expense.  Our management also uses non-GAAP adjusted EBITDA for planning purposes, including the preparation of our annual operating budget and financial projections.  Provision for litigation represents costs incurred for litigation settlements or unfavorable verdicts when the loss is known or considered probable and the amount can be reasonably estimated, or in the case of a favorable settlement, when income is realized.  Acquisition related costs/licensing represents the change in fair value of business acquisition related contingent consideration; costs related to integrating recently acquired businesses including but not limited to costs to exit or convert contractual obligations, severance, and information system conversion; and specific costs related to the consummation of the acquisition process such as banker fees, legal fees, and other acquisition related professional fees, as well as one time licensing fees.   Net gain from sale of assets represents the gain on sale of assets and the offsetting impact of costs incurred through the sale.

In addition, for the period ended June 30, 2018 and for other comparative periods, we are presenting non-GAAP net income and non-GAAP diluted earnings per share, which represents net income and diluted earnings per share excluding the provision for litigation, amortization of intangibles, acquisition related costs/licensing, net gain from the sale of assets and the tax effects of such adjustments.  We believe these non-GAAP measures are also useful indicators of our operating performance, and particularly as additional measures of comparative operating performance from period to period as they remove the effects of litigation, amortization of intangibles, acquisition related costs/licensing, net gain from the sale of assets and the tax effects of such adjustments, which we believe are not reflective of underlying business trends.  Additionally, for the periods ended June 30, 2018 and for other comparative periods, we also define the non-GAAP measure of free cash flow as the net cash provided by operating activities, adjusted for the impact of restricted cash, less the cash impact of purchases of property and equipment.  We believe that this financial measure provides meaningful information for evaluating our overall financial performance for comparative periods as it facilitates an assessment of funds available to satisfy current and future obligations and fund acquisitions.  Furthermore, the non-GAAP measure of constant currency sales growth is calculated by translating current year sales at the same average exchange rates in effect during the applicable prior year period.  We believe constant currency sales growth provides insight to the comparative increase or decrease in period sales, in dollar and percentage terms, excluding the effects of fluctuations in foreign currency exchange rates.

Non-GAAP adjusted EBITDA, non-GAAP net income, non-GAAP diluted earnings per share, free cash flow and constant currency sales growth are not calculated in conformity with U.S. GAAP.  Non-GAAP financial measures have limitations as analytical tools and should not be considered in isolation or as a substitute for financial measures prepared in accordance with U.S. GAAP.  These measures do not include certain expenses that may be necessary to evaluate our liquidity or operating results.  Our definitions of non-GAAP adjusted EBITDA, non-GAAP net income, non-GAAP diluted earnings per share, free cash flow and constant currency sales growth may differ from that of other companies and therefore may not be comparable.  Additionally, we have recast prior periods for non-GAAP net income and non-GAAP diluted earnings per share.

Safe Harbor Statements

All statements included in this press release other than statements of historical fact are forward-looking statements and may be identified by their use of words such as “believe,” “may,” “might,” “could,” “will,” “aim,” “estimate,” “continue,” “anticipate,” “intend,” “expect,” “plan” and other similar terms.  These forward-looking statements are based on our current assumptions, expectations and estimates of future events and trends.  Forward-looking statements are only predictions and are subject to many risks, uncertainties and other factors that may affect our businesses and operations and could cause actual results to differ materially from those predicted.  These risks and uncertainties include, but are not limited to, factors affecting our quarterly results, our ability to manage our growth, our ability to sustain our profitability, demand for our products, our ability to compete successfully (including without limitation our ability to convince surgeons to use our products and our ability to attract and retain sales and other personnel), our ability to rapidly develop and introduce new products, our ability to develop and execute on successful business strategies, our ability to successfully integrate the international operations acquired from Alphatec, both in general and on our anticipated timeline, our ability to transition Alphatec’s international customers to Globus products, our ability to realize the expected benefits to our results from the Alphatec acquisition, our ability to comply with laws and regulations that are or may become applicable to our businesses, our ability to safeguard our intellectual property, our success in defending legal proceedings brought against us, trends in the medical device industry, general economic conditions, and other risks.  For a discussion of these and other risks, uncertainties and other factors that could affect our results, you should refer to the disclosure contained in our most recent annual report on Form 10-K filed with the Securities and Exchange Commission, including the sections labeled “Risk Factors” and “Cautionary Note Concerning Forward-Looking Statements,” and in our Forms 10-Q, Forms 8-K and other filings with the Securities and Exchange Commission.  These documents are available at www.sec.gov.  Moreover, we operate in an evolving environment.  New risk factors and uncertainties emerge from time to time and it is not possible for us to predict all risk factors and uncertainties, nor can we assess the impact of all factors on our business or the extent to which any factor, or combination of factors, may cause actual results to differ materially from those contained in any forward-looking statements.  Given these risks and uncertainties, readers are cautioned not to place undue reliance on any forward-looking statements.  Forward-looking statements contained in this press release speak only as of the date of this press release.  We undertake no obligation to update any forward-looking statements as a result of new information, events or circumstances or other factors arising or coming to our attention after the date hereof.

GLOBUS MEDICAL, INC. AND SUBSIDIARIES
CONDENSED CONSOLIDATED STATEMENTS OF INCOME
(unaudited)
Three Months Ended Six Months Ended
(In thousands, except per share amounts) June 30,
2018
June 30,
2017
June 30,
2018
June 30,
2017
Sales $ 173,384 $ 152,390 $ 347,795 $ 308,199
Cost of goods sold 37,637 37,199 75,607 72,799
Gross profit 135,747 115,191 272,188 235,400
Operating expenses:
Research and development 13,523 10,713 26,210 21,379
Selling, general and administrative 77,125 64,438 152,819 131,497
Provision for litigation 243 243
Amortization of intangibles 2,178 1,809 4,365 3,591
Acquisition related costs 782 617 1,021 1,005
Total operating expenses 93,608 77,820 184,415 157,715
Operating income 42,139 37,371 87,773 77,685
Other income/(expense), net 8,165 2,186 10,609 4,286
Income before income taxes 50,304 39,557 98,382 81,971
Income tax provision 5,327 10,890 13,866 24,590
Net income $ 44,977 $ 28,667 $ 84,516 $ 57,381
Earnings per share:
Basic $ 0.46 $ 0.30 $ 0.87 $ 0.60
Diluted $ 0.44 $ 0.29 $ 0.84 $ 0.59
Weighted average shares outstanding:
Basic 97,830 96,161 97,337 96,079
Diluted 101,510 97,818 101,005 97,483


READ THE REST HERE


Orthopedic-Devices_12bto-1.png

August 1, 2018 OrthoSpineNews

NEW YORK, August 1, 2018 /PRNewswire/ — Orthopedic Devices Market Size, Share & Trends Analysis Report By Application (Hip, Knee, Spine, Dental, Craniomaxillofacial, Sports Injuries, Extremities, and Trauma), By Product, And Segment Forecasts, 2018 – 2024

Read the full report: https://www.reportlinker.com/p05479699 

The global orthopedic devices market size is expected to reach USD 43.1 billion by 2024, according to a study by Grand View Research, Inc. It is anticipated to expand at a CAGR of 4.4% over the forecast period. Major market drivers include rising demand for orthopedic surgeries owing to rise in road accidents and high prevalence of orthopedic ailments.

Growth in geriatric population prone to orthopedic conditions is primarily pushing demand for orthopedic solutions globally. Effects of aging, such as diminishing bone density and weakening bones due to excessive loss of bone mass, make their presence felt from 35 years of age and become more prominent after 55 years.

High adoption of minimally invasive surgeries and increasing number of sport-related injuries and road accidents are expected to fuel demand for orthopedic devices during the forecast period.Arthroscopy, minimally invasive total joint replacement, and spine surgeries are some of the newly adopted minimally invasive surgeries driving the market.

On the down side, stringent regulatory approval procedures are key factors restraining market growth. In addition, high cost of these devices and surgical procedures threaten the growth of the market.

Further key findings from the study suggest:

• The knee surgery segment captured the largest revenue share in 2016 accredited to rising knee surgeries, ranging from common knee injuries to total knee replacements

• The hip surgery segment captured second largest revenue share in 2016, fueled by availability of a wide range of treatment products

• North America is expected to maintain its dominance throughout the forecast period. Presence of a large number of major players and high adoption of advanced technologies are regional growth drivers

• Asia Pacific is expected to exhibit a lucrative CAGR during the forecast period. Presence of untapped opportunities, coupled with supportive government regulations, is expected to attract global players

• Some of the major market players are NuVasive, Inc.; Medtronic PLC; Zimmer-Biomet Holdings; DePuy Synthes Companies; Stryker Corporation; Aesculap Implant Systems, Inc.; Donjoy, Inc.; and Conmed Corporation.

Read the full report: https://www.reportlinker.com/p05479699 

About Reportlinker 

ReportLinker is an award-winning market research solution. Reportlinker finds and organizes the latest industry data so you get all the market research you need – instantly, in one place. 

__________________________ 

Contact Clare: clare@reportlinker.com 

US: (339)-368-6001 

Intl: +1 339-368-6001

SOURCE Reportlinker

Related Links

http://www.reportlinker.com


osiris-therapeutics-office.jpg

August 1, 2018 OrthoSpineNews

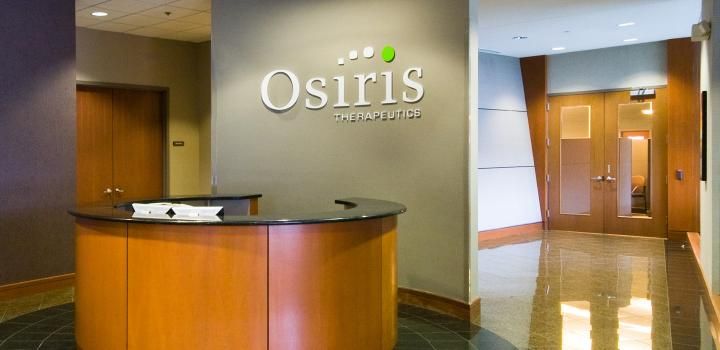
COLUMBIA, Md., Aug. 01, 2018 (GLOBE NEWSWIRE) — Osiris Therapeutics, Inc. (NASDAQ: OSIR), a regenerative medicine company focused on developing and marketing products for wound care, orthopedics, and sports medicine, today announced that The Nasdaq Stock Market LLC has approved its application to list its common stock on The Nasdaq Global Market. Osiris’s common stock will commence trading at the market open today, Wednesday, August 1, 2018, under the ticker symbol “OSIR”.

About Osiris Therapeutics

Osiris Therapeutics, Inc., based in Columbia, Maryland, researches, develops, manufactures and commercializes regenerative medicine products intended to improve the health and lives of patients and lower overall healthcare costs. We have achieved commercial success with products in orthopedics, sports medicine and wound care, including the Grafix product line, Stravix®, BIO and Cartiform®. We continue to advance our research and development by focusing on innovation in regenerative medicine, including the development of bioengineered stem cell and tissue‑based products. Osiris®, Grafix® and Cartiform® are our trademarks. BIO4® is a trademark of Howmedica Osteonics Corp., a subsidiary of Stryker Corporation. More information can be found on the Company’s website, www.Osiris.com. (OSIR-G)

For additional information, please contact:

Diane Savoie
Osiris Therapeutics, Inc.
(443) 545-1834
OsirisPR@Osiris.com


NuVasive_1_Full-1-BI-2.jpg

August 1, 2018 OrthoSpineNews

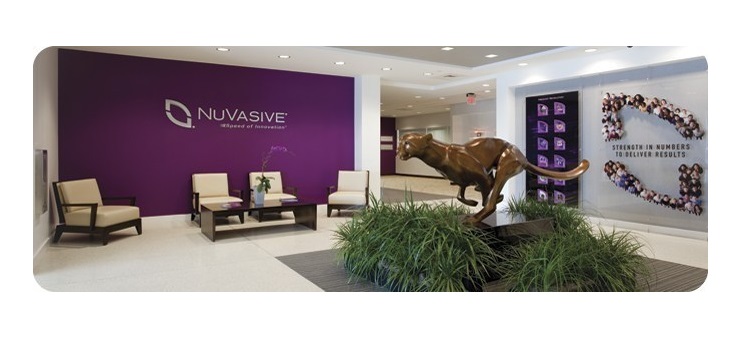
SAN DIEGOJuly 31, 2018 /PRNewswire/ — NuVasive, Inc. (NASDAQ: NUVA), the leader in spine technology innovation, focused on transforming spine surgery with minimally disruptive, procedurally-integrated solutions, today announced financial results for the quarter ended June 30, 2018.

Second Quarter 2018 Highlights

  • Revenue increased 8.5% to $281.6 million, or 7.7% on a constant currency basis;
  • GAAP operating profit margin of 10.1%; Non-GAAP operating profit margin of 16.3%; and
  • GAAP diluted earnings per share increase of 5% to $0.22; Non-GAAP diluted earnings per share increase of 29% to $0.58.

“We are pleased with our second quarter total revenue growth of 8.5% year-over-year driven by momentum in our U.S. Spinal Hardware business where we saw spine case volumes up nearly 7% versus prior year,” said Gregory T. Lucier, chairman and chief executive officer of NuVasive. “We continue to see strong demand for new product introductions from late last year and positive surgeon conversion efforts as our new Lateral Single-Position Surgery procedure gains traction in the market. Our International business also delivered a solid performance with 21% year-over-year growth.”

A full reconciliation of GAAP to non-GAAP measures can be found in the tables of this news release.

Second Quarter 2018 Results

NuVasive reported second quarter 2018 total revenue of $281.6 million, an 8.5% increase compared to $259.4 million for the second quarter 2017. On a constant currency basis, second quarter 2018 total revenue increased 7.7% compared to the same period last year.

For the second quarter 2018, GAAP and non-GAAP gross profit was $204.5 million and $204.9 million, respectively, and GAAP and non-GAAP gross margin was 72.6% and 72.8%, respectively. These results compared to both GAAP and non-GAAP gross profit of $193.2 million, and both GAAP and non-GAAP gross margin of 74.5% for the second quarter 2017. Gross margins for the second quarter 2018 were impacted by the Company’s in-source manufacturing efforts at the West Carrollton facility, which are expected to improve over the second half of 2018.

The Company reported GAAP net income of $11.5 million, or $0.22 per share, for the second quarter 2018 compared to GAAP net income of $12.2 million, or $0.21 per share, for the second quarter 2017. On a non-GAAP basis, the Company reported net income of $30.3 million, or $0.58 per share, for the second quarter 2018 compared to net income of $23.6 million, or $0.45 per share, for the second quarter 2017.

Annual Financial Guidance for 2018 

The Company updated its full-year 2018 guidance as follows:

2018 Guidance Range 1

Prior

Current

(in million’s; except %’s and EPS)

 GAAP 

 Non-GAAP 

 GAAP 

 Non-GAAP 

Revenue

$    1,095

$    1,105

$ 1,095

$    1,105

$ 1,095

$ 1,105

$ 1,095

$ 1,105

  % Growth – Reported 2

6.7%

7.6%

6.7%

7.6%

6.7%

7.6%

6.7%

7.6%

% Growth – Constant Currency 2, 3

5.7%

6.6%

6.3%

7.3%

Operating margin

9.6%

9.7%

17.6%

17.6%

8.0%

8.1%

16.7%

16.7%

Earnings per share

$      0.71

$      0.74

$   2.44

$      2.47

$   0.45

$   0.48

$   2.37

$   2.40

EBITDA

19.5%

19.5%

26.9%

26.9%

18.7%

18.7%

25.9%

25.9%

Tax Rate

~31%

~31%

~23%

~23%

~33%

~33%

~21%

~21%

  1

Prior guidance reflects the range provided May 1, 2018. Current guidance reflects the range provided July 31, 2018.

  2

2017 has been recasted and presented based on our full retrospective method of adoption of ASC 606.

 3

Constant currency is a measure that adjusts US GAAP revenue for the impact of currency over the same period in the prior year.

  • Full-year 2018 revenue remains in the range of $1,095 million to $1,105 million reflecting reported growth of 6.7% to 7.6%, and growth in the range of 4.7% to 5.7%, exclusive of the SafePassage acquisition;
  • Non-GAAP diluted earnings per share in a range of $2.37 to $2.40 compared with the prior expectation of $2.44 to $2.47;
  • Non-GAAP operating profit margin of approximately 16.7% compared with the prior expectation of 17.6%;
  • Adjusted EBITDA margin of approximately 25.9% compared with the prior expectation of 26.9%;
  • Non-GAAP effective tax expense rate of approximately 21%, compared with the prior expectation of approximately 23%;
  • The Company expects currency to have a positive impact on revenue in 2018 of approximately $3 million compared with the prior expectation of $10 million; and
  • The Company expects to drive an adjusted EBITDA of approximately $283 million to $293 million.

The above guidance assumes a full-year benefit of U.S. tax reform, suspension of the medical device tax and the SafePassage acquisition.

Supplementary Financial Information

For additional financial detail, please visit the Investor Relations section of the Company’s website at www.nuvasive.comto access Supplementary Financial Information.

Reconciliation of Full Year EPS Guidance

2017

Actuals1, 2

2018 Guidance Range

Prior1, 3, 4

Current  1, 3, 5

GAAP net income per share

$       1.48

$  0.71

$  0.74

$  0.45

$  0.48

Impact of change to diluted share count

0.08

0.01

0.01

GAAP net income per share, adjusted to diluted Non-GAAP share count

$       1.56

$  0.72

$  0.75

$  0.45

$  0.48

Business transition costs 6

0.08

0.07

0.07

0.13

0.13

Non-cash purchase accounting adjustments on acquisitions 7

0.01

0.02

0.02

0.02

0.02

Non-cash interest expense on convertible notes

0.33

0.32

0.32

0.32

0.32

Litigation related expenses and settlements 8

0.09

0.55

0.55

0.60

0.60

Non-recurring consulting fees 9

0.12

0.12

0.13

0.13

Impairment of strategic investment

0.17

0.17

0.17

0.17

Amortization of intangible assets 10

0.89

0.89

0.89

0.95

0.95

Tax effect of adjustments 11

(1.08)

(0.42)

(0.42)

(0.40)

(0.40)

Non-GAAP earnings per share

$       1.89

$  2.44

$  2.47

$  2.37

$  2.40

GAAP Weighted shares outstanding – basic

50,874

51,025

51,025

51,397

51,397

GAAP Weighted shares outstanding – diluted

55,193

52,647

52,647

52,131

52,131

Non-GAAP Weighted shares outstanding – diluted 12

52,345

52,185

52,185

52,131

52,131

1

Items may not foot due to rounding.

2

2017 has been recasted and presented based on our full retrospective method of adoption of ASC 606 as well as for expenses associated with ongoing litigation with a former Board member and his current employer related to various matters, including infringement of the Company’s intellectual property.

3

Prior guidance reflects the range provided May 1, 2018. Current guidance reflects the range provided July 31, 2018.

4

Effective tax expense rate of ~31% applied to GAAP earnings and ~23% applied to Non-GAAP earnings.

5

Effective tax expense rate of ~33% applied to GAAP earnings and ~21% applied to Non-GAAP earnings.

6

Costs related to acquisition, integration and business transition activities which include severance, relocation, consulting, leasehold exit costs, third party merger and acquisitions costs, contingent consideration fair value adjustments, and other costs directly associated with such activities.

7

Represents costs associated with non-cash purchase accounting adjustments, such as acquired inventory fair market value adjustments, which are amortized over the period in which underlying products are sold.

8

Related to the Medtronic litigation matter for fiscal year 2017. Represents the settlement loss in connection with the Madsen Medical, Inc. litigation matter as well as expenses associated with ongoing litigation with a former Board member and his current employer related to various matters, including infringement of the Company’s intellectual property for fiscal year 2018.

9

Non-recurring consulting fees associated with the implementation of our state tax-planning strategy.

10

2017 results exclude the amortization associated with non-controlling interest.

11

The impact on results from taxes include tax effecting the adjustments above at the statutory rate as well as taking into account discrete items and including those discrete items in the annual effective tax rate calculation. The Company also includes those adjustments that would have benefited the tax rate in lieu of the above adjustments as part of the Company’s tax filings. The impact of the changes to the tax rate results in an annual estimated rate of ~33% on a GAAP basis and ~21% on a non-GAAP basis.

12

Adjusted non-GAAP diluted WASO excludes the impact of dilutive convertible notes and warrants for which the Company is economically hedged through its anti-dilutive bond hedge arrangements.


l2-2.jpg

July 31, 2018 OrthoSpineNews

CARLSBAD, Calif., July 30, 2018 (GLOBE NEWSWIRE) — SeaSpine Holdings Corporation (NASDAQ:SPNE), a global medical technology company focused on surgical solutions for the treatment of spinal disorders, announced today financial results for the quarter ended June 30, 2018 and updated its financial outlook for 2018.

Summary Second Quarter 2018 Financial Results and Recent Accomplishments

  • Revenue of $36.4 million, an increase of 6.5% year-over-year
  • U.S. revenue of $32.6 million, an increase of 7.5% year-over-year
    • U.S. Spinal Implants revenue of $16.0 million, an 11.5% increase year-over-year
    • U.S. Orthobiologics revenue of $16.6 million, a 4.0% increase year-over-year
  • Renewed credit facility with Wells Fargo Bank to extend three years through July 2021, with an option to increase the limit by $10 million to $40 million
  • Transitioned OsteoStrand™ Demineralized Bone Fibers to full commercial launch
  • Received 510(k) clearance and launched instrumentation designed for use with frequently used third-party surgical navigation system
  • Launched comprehensive posterior decompression and disc preparation instrument system

“We are pleased to report strong operating performance, which reflects solid revenue growth and gross margin expansion,” said Keith Valentine, President and Chief Executive Officer. “We continue to advance our strategic objectives driven by our innovative product pipeline, strengthening distribution footprint and expanded and more effective medical education and training programs.”

Second Quarter 2018 Financial Results
Total revenue for the second quarter of 2018 was $36.4 million, a 6.5% increase compared to the same period of the prior year. Total U.S. revenue was $32.6 million, a 7.5% increase compared to the same period of the prior year.

Spinal Implants revenue totaled $17.8 million, a 7.2% increase compared to the second quarter of 2017, and was driven by growth in recently launched products, led primarily by the Shoreline and Mariner systems. Orthobiologics revenue totaled $18.6 million, a 5.8% increase compared to the second quarter of 2017, and was led by growth in the DBM franchise, including the Company’s OsteoBallast™ and OsteoStrand™ products.

Gross margin for the second quarter of 2018 was 60.0%, compared to 59.1% for the same period in 2017. The increase was primarily driven by higher gross margins associated with U.S. spinal implant sales, which were higher as a percentage of total revenue compared to the same period of the prior year.

Operating expenses for the second quarter of 2018 totaled $29.0 million, compared to $28.4 million for the same period of the prior year. The $0.6 million increase in operating expenses was driven by higher selling and marketing expenses, partially offset by lower R&D and general and administrative expenses.

Net loss for the second quarter of 2018 was $7.4 million, compared to a net loss of $8.0 million for the same period of the prior year.

Cash and cash equivalents at June 30, 2018 totaled $13.3 million and the Company borrowed $4.0 million of cash under its credit facility during the second quarter of 2018.

2018 Financial Outlook
SeaSpine expects full-year 2018 revenue to be in the range of $136 to $139 million, reflecting growth of 3.2% to 5.5% over full-year 2017 revenue.

Webcast and Conference Call Information
The Company’s management team will host a conference call beginning today at 1:30pm PT/4:30pm ET to discuss the financial results and recent business developments. Individuals interested in listening to the conference call may do so by dialing (877) 418-4766 for domestic callers or (614) 385-1253 for international callers, using Conference ID: 7260839.  To listen to the webcast, please visit the Investors section of the SeaSpine website at: www.seaspine.com.

The call will be archived until Friday, August 31, 2018. The audio archive can be accessed by calling (855) 859-2056 in the U.S. or (404) 537-3406 from outside the U.S. The passcode for the audio replay is 7260839.

About SeaSpine
SeaSpine (www.seaspine.com) is a global medical technology company focused on the design, development and commercialization of surgical solutions for the treatment of patients suffering from spinal disorders. SeaSpine has a comprehensive portfolio of orthobiologics and spinal implants solutions to meet the varying combinations of products that neurosurgeons and orthopedic spine surgeons need to perform fusion procedures on the lumbar, thoracic and cervical spine. SeaSpine’s orthobiologics products consist of a broad range of advanced and traditional bone graft substitutes that are designed to improve bone fusion rates following a wide range of orthopedic surgeries, including spine, hip, and extremities procedures. SeaSpine’s spinal implants portfolio consists of an extensive line of products to facilitate spinal fusion in minimally invasive surgery (MIS), complex spine, deformity and degenerative procedures. Expertise in both orthobiologic sciences and spinal implants product development allows SeaSpine to offer its surgeon customers a differentiated portfolio and a complete procedural solution to meet their fusion requirements. SeaSpine currently markets its products in the United States and in over 30 countries worldwide.

Forward-Looking Statements
SeaSpine cautions you that statements included in this news release that are not a description of historical facts are forward-looking statements that are based on the Company’s current expectations and assumptions. Such forward-looking statements include, but are not limited to, statements relating to: the Company’s ability to advance its strategic objectives through its product pipeline, distribution footprint, and medical education and training programs; and the Company’s expectations for full-year 2018 revenue.  Among the factors that could cause or contribute to material differences between the Company’s actual results and the expectations indicated by the forward-looking statements are risks and uncertainties that include, but are not limited to: surgeons’ willingness to continue to use the Company’s existing products and to adopt its newly launched products, including the risk that the Company’s products do not demonstrate adequate safety or efficacy, independently or relative to competitive products, to support expected levels of demand or pricing; the Company’s ability to continue to invest in medical education and training, product development, and/or sales and marketing initiatives at levels sufficient to drive future revenue growth, including as a result of its inability to obtain funding on a timely basis on acceptable terms, or at all; the ability of newly launched products to perform as designed and intended and to meet the needs of surgeons and patients, including as a result of the lack of clinical validation of products in limited commercial (or “alpha”) launch; the Company’s ability to attract new, high-quality distributors, whether as a result of inability to reach agreement on financial or other contractual terms or otherwise, disruption to the Company’s existing distribution network as new distributors are added, and the ability of new distributors to generate growth or offset disruption to existing distributors; continued pricing pressure, whether as a result of consolidation in hospital systems, competitors or others, as well as exclusion from major healthcare systems, whether as a result of unwillingness to provide required pricing or otherwise; the risk of supply shortages and the associated, potentially long-term disruption to product sales, including as a result of the Company’s dependence on a limited number of third-party suppliers for components and raw materials, or otherwise; unexpected expense and delay, including as a result of developing and supporting the launch of new products, the fact that newly launched products may require substantial additional development activities, which could introduce further expense and delay, or as a result of obtaining regulatory clearances; general economic and business conditions in the markets in which the Company does business, both in the U.S. and abroad; and other risks and uncertainties more fully described in the Company’s news releases and periodic filings with the Securities and Exchange Commission. The Company’s public filings with the Securities and Exchange Commission are available at www.sec.gov.

You are cautioned not to place undue reliance on forward-looking statements, which speak only as of the date when made. SeaSpine does not intend to revise or update any forward-looking statement set forth in this news release to reflect events or circumstances arising after the date hereof, except as may be required by law.

Investor Relations Contact
Lynn Pieper
(415) 937-5402
ir@seaspine.com

SEASPINE HOLDINGS CORPORATION
UNAUDITED CONDENSED CONSOLIDATED STATEMENTS OF OPERATIONS
(In thousands, except per share data)
Three Months Ended
June 30,
Six Months Ended
June 30,
2018 2017 2018 2017
Total revenue, net $ 36,409 $ 34,196 $ 69,584 $ 66,090
Cost of goods sold 14,560 13,994 26,739 27,166
Gross profit 21,849 20,202 42,845 38,924
Operating expenses:
Selling, general and administrative 25,432 24,249 49,899 48,219
Research and development 2,791 3,344 5,580 6,394
Intangible amortization 792 792 1,584 1,584
Total operating expenses 29,015 28,385 57,063 56,197
Operating loss (7,166 ) (8,183 ) (14,218 ) (17,273 )
Other (expense) income, net (157 ) 185 (137 ) 172
Loss before income taxes (7,323 ) (7,998 ) (14,355 ) (17,101 )
Provision for income taxes 38 45 111 45
Net loss $ (7,361 ) $ (8,043 ) $ (14,466 ) $ (17,146 )
Net loss per share, basic and diluted $ (0.50 ) $ (0.68 ) $ (1.01 ) $ (1.46 )
Weighted average shares used to compute basic and diluted net loss per share 14,590 11,888 14,339 11,705
SEASPINE HOLDINGS CORPORATION
CONDENSED CONSOLIDATED BALANCE SHEET DATA
(In thousands)
June 30, 2018 December 31,
2017
(unaudited)
Cash and cash equivalents $ 13,263 $ 10,788
Trade accounts receivable, net of allowances of $474 and $466 20,894 21,872
Inventories 42,449 41,721
Short-term debt
Total current liabilities 24,719 23,157
Long-term borrowings under credit facility 4,000
Total stockholders’ equity 101,562 105,653


The-four-main-types-of-bone-graft-substitutes-a-granule-b-block-or-pre-form-c-12bto-1.jpg

July 31, 2018 OrthoSpineNews

LONDONJuly 31, 2018 /PRNewswire/ — Bone Grafts and Substitutes Market Size, Share & Trends Analysis Report By Material Type (Natural, Synthetic), By Application Type (Spinal Fusion, Craniomaxillofacial, Long Bone), By Region, And Segment Forecasts, 2018 – 2025.

Download the full report: https://www.reportbuyer.com/product/5479697 

The global bone grafts and substitutes market size is expected to reach USD 3.9 billion by 2025, according to a new report by Grand View Research, Inc. The market is expected to register a healthy CAGR of 5.5% during the forecast period. Demand for bone grafts and substitutes is increasing due to adoption of newer technologies and increasing demand for minimally invasive procedures.

Availability of advanced products in varied shapes and sizes providing high osteoconductive and osteoinductive properties is supporting market growth.Moreover, growing adoption of minimally invasive procedures is spurring demand for bone grafts and substitutes.

In minimally invasive procedures, large incisions and damage to muscles surrounding repair area can be significantly avoided.These techniques also reduce the duration of hospital stay and support rapid wound healing with lesser pain and surgical wounds.

Minimally invasive total joint replacement and spine surgeries are some of the newly adopted procedures. Some of the companies in the bone grafts and substitutes market are DePuy Synthes; Medtronic PLC; Nuvasive, Inc.; Orthofix Holdings, Inc.; Wright Medical Group N.V.; AlloSource, Inc.; and Stryker Corp.

Further key findings from the study suggest:

• Increasing number of orthopedic surgeries and rising demand for minimally invasive surgeries are primary factors driving market growth

• By material type, allografts accounted for the largest market share within the natural segment in 2016, mainly due to properties such as immediate structural support and osteoconductivity. Moreover, allografts do not require another surgery to harvest the bone, which results in reduced surgery time and wound healing, thus, attributing toward segment growth

• North America is the leading regional market, followed by Europe. Rising awareness regarding commercially available products, higher healthcare expenditure, and availability of advanced healthcare infrastructure are prime factors responsible for the region’s expansion

• Key players in the market include DePuy Synthes; Medtronic PLC; Nuvasive, Inc.; Orthofix Holdings, Inc.; Wright Medical Group N.V.; AlloSource, Inc.; and Stryker Corp.


Download the full report: https://www.reportbuyer.com/product/5479697 


About Reportbuyer 

Reportbuyer is a leading industry intelligence solution that provides all market research reports from top publishers 

For more information: 

Sarah Smith 

Research Advisor at Reportbuyer.com 

Email: sarah@reportbuyer.com 

Tel: +1 (718) 213 4904 

Website: www.reportbuyer.com

SOURCE ReportBuyer

Related Links

http://www.reportbuyer.com


stryker-headquarters-2.jpg

July 27, 2018 OrthoSpineNews

Kalamazoo, Michigan – July 24, 2018 – Stryker Corporation (NYSE:SYK) reported operating results for the second quarter of 2018:

Second Quarter Highlights

2018 Net Sales Growth Overview
Reported Excluding ASC 606 Adoption(2) Foreign Currency Exchange Constant Currency Acquisitions Organic
Orthopaedics 7.6 % 8.0 % 1.4 % 6.6 % 6.6 %
MedSurg 8.9 10.0 0.8 9.2 1.9 7.3
Neurotechnology and Spine 19.4 20.1 1.6 18.5 6.1 12.4
Total 10.3 % 11.0 % 1.1 % 9.9 % 2.0 % 7.9 %

“We continue to execute on our strategy and delivered another strong quarter of organic sales growth, adjusted operating margin expansion and adjusted net earnings per diluted share,” said Kevin A. Lobo, Chairman and Chief Executive Officer.  “Our diversified and decentralized business unit model combined with strong talent and culture continue to serve us well. We have raised our guidance to reflect the strong results and positive outlook for the remainder of the year.”

Sales Analysis (percentages exclude ASC 606(2) adoption impact)

Consolidated net sales of $3.3 billion increased 11.0% in the quarter and 9.9% in constant currency. Organic net sales increased 7.9% in the quarter including 9.0% from increased unit volume partially offset by 1.1% from lower prices.

Orthopaedics net sales of $1.2 billion increased 8.0% in the quarter and 6.6% in constant currency. Organic net sales increased 6.6% in the quarter including 8.9% from increased unit volume partially offset by 2.3% from lower prices.

MedSurg net sales of $1.5 billion increased 10.0% in the quarter and 9.2% in constant currency. Organic net sales increased 7.3% in the quarter including 7.6% from increased unit volume partially offset by 0.3% from lower prices.

Neurotechnology and Spine net sales of $0.6 billion increased 20.1% in the quarter and 18.5% in constant currency. Organic net sales increased 12.4% in the quarter including 13.3% from increased unit volume partially offset by 0.9% from lower prices.

Earnings Analysis

Reported net earnings of $452 million increased 15.6% in the quarter. Reported net earnings per diluted share of $1.19 increased 15.5% in the quarter. Reported net earnings include certain items, including charges for acquisition and integration-related activities, the amortization of purchased intangible assets, restructuring-related and other charges, compliance with European Medical Devices Regulation, Rejuvenate and other recall-related matters, regulatory and legal matters and tax matters. The effect of each of these matters on reported net earnings and net earnings per diluted share appear in the reconciliation of GAAP to non-GAAP financial measures. Excluding the aforementioned items increases gross profit margin from 65.9% to 66.1% in the quarter and increases operating income margin from 20.2% to 25.7%(1), including a 20 basis point favorable impact related to the adoption of the new revenue recognition standard(2). Excluding the impact of the items described above, adjusted net earnings(4) of $670 million increased 15.3% in the quarter. Adjusted net earnings per diluted share(3) of $1.76 increased 15.0% in the quarter.

2018 Outlook

Based on our year-to-date performance we now expect 2018 organic net sales growth, which excludes the impact related to adoption of the new revenue recognition standard(2), to be in the range of 7.0% to 7.5% and expect adjusted net earnings per diluted share(5) to be in the range of $7.22 to $7.27. In 2018 our calculation of organic net sales growth excludes the impact of adopting ASC 606(2), which includes primarily the reclassification of costs previously reported within selling expenses to a reduction of sales, which for 2017 was approximately $112 million ($28 million per quarter). For the third quarter we expect adjusted net earnings per diluted share(5) to be in the range of $1.65 to $1.70. If foreign currency exchange rates hold near current levels, we expect net sales in the third quarter will be negatively impacted by approximately 0.9% and full year will be positively impacted by approximately 0.5% and net earnings per diluted share will be neutral in the third quarter and positively impacted by $0.05 in the full year.

 (1) A reconciliation of operating income to adjusted operating income, a non-GAAP financial measure, and other important information accompanies this press release.

(2) Consistent with previous press releases and financial disclosures, we adopted Accounting Standards Update 2014-09, Revenue From Contracts with Customers, as well as related amendments (ASC 606), issued by the Financial Accounting Standards Board on a modified retrospective basis, effective January 1, 2018. The impact of the adoption of ASC 606 related primarily to the reclassification of certain costs previously presented as selling, general and administrative expenses to net sales.

(3) A reconciliation of reported net earnings per diluted share to adjusted net earnings per diluted share, a non-GAAP financial measure, and other important information accompanies this press release.

(4) A reconciliation of reported net earnings to adjusted net earnings, a non-GAAP financial measure, and other important information accompanies this press release.

(5) A reconciliation of expected net earnings per diluted share to expected adjusted net earnings per diluted share for the third quarter and full year and other important information accompanies this press release.

Conference Call on Tuesday, July 24, 2018

As previously announced, Stryker will host a conference call on Tuesday, July 24, 2018 at 4:30 p.m., Eastern Time, to discuss the Company’s operating results for the quarter ended June 30, 2018 and provide an operational update.

To participate in the conference call dial (844) 826-0610 (domestic) or (973) 453-3249 (international) and be prepared to provide conference ID number 7449506 to the operator.

A simultaneous webcast of the call will be accessible via the Company’s website at www.stryker.com. The webcast will be archived on the Investors page of this site.

A recording of the call will also be available from 8:00 p.m., Eastern Time, on Tuesday, July 24, 2018, until 11:59 p.m., Eastern Time, on Tuesday, July 31, 2018. To hear this recording, you may dial (855) 859-2056 (domestic) or (404) 537-3406 (international) and enter conference ID number 7449506.

Forward-Looking Statements

This press release contains information that includes or is based on forward-looking statements within the meaning of the federal securities laws that are subject to various risks and uncertainties that could cause our actual results to differ materially from those expressed or implied in such statements. Such factors include, but are not limited to: weakening of economic conditions that could adversely affect the level of demand for our products; pricing pressures generally, including cost-containment measures that could adversely affect the price of or demand for our products; changes in foreign exchange markets; legislative and regulatory actions; unanticipated issues arising in connection with clinical studies and otherwise that affect U.S. Food and Drug Administration approval of new products; potential supply disruptions; changes in reimbursement levels from third-party payors; a significant increase in product liability claims; the ultimate total cost with respect to the Rejuvenate and ABG II matter; the impact of investigative and legal proceedings and compliance risks; resolution of tax audits; the impact of the federal legislation to reform the United States healthcare system; changes in financial markets; changes in the competitive environment; our ability to integrate acquisitions; and our ability to realize anticipated cost savings. Additional information concerning these and other factors is contained in our filings with the U.S. Securities and Exchange Commission, including our Annual Report on Form 10-K and Quarterly Reports on Form 10-Q.

Stryker is one of the world’s leading medical technology companies and, together with its customers, is driven to make healthcare better. The Company offers innovative products and services in Orthopaedics, Medical and Surgical, and Neurotechnology and Spine that help improve patient and hospital outcomes. More information is available at www.stryker.com.

For investor inquiries please contact:

Katherine A. Owen, Stryker Corporation, 269-385-2600 or katherine.owen@stryker.com

For media inquiries please contact:

Yin Becker, Stryker Corporation, 269-385-2600 or yin.becker@stryker.com


STRYKER CORPORATION
For the Three and Six Months June 30
(Unaudited – Millions of Dollars, Except Per Share Amounts)
CONSOLIDATED STATEMENTS OF EARNINGS
Three Months Six Months
2018 2017 % Change 2018 2017 % Change
Net sales $ 3,322 $ 3,012 10.3 % $ 6,563 $ 5,967 10.0 %
Cost of sales 1,132 1,021 10.9 2,236 2,012 11.1 %
Gross profit $ 2,190 $ 1,991 10.0 % $ 4,327 $ 3,955 9.4 %
% of sales 65.9 % 66.1 % 65.9 % 66.3 %
Research, development and engineering expenses 216 192 12.5 420 384 9.4 %
Selling, general and administrative expenses 1,190 1,130 5.3 2,426 2,232 8.7 %
Recall charges 2 72 (97.2 ) 6 98 (93.9 )%
Amortization of intangible assets 110 95 15.8 212 183 15.8 %
Total operating expenses $ 1,518 $ 1,489 1.9 % $ 3,064 $ 2,897 5.8 %
Operating income $ 672 $ 502 33.9 % $ 1,263 $ 1,058 19.4 %
% of sales 20.2 % 16.7 % 19.2 % 17.7 %
Other income (expense), net (49 ) (58 ) (15.5 ) (98 ) (115 ) (14.8 )%
Earnings before income taxes $ 623 $ 444 40.3 % $ 1,165 $ 943 23.5 %
Income taxes 171 53 222.6 270 108 150.0 %
Net earnings $ 452 $ 391 15.6 % $ 895 $ 835 7.2 %
Net earnings per share of common stock:
Basic net earnings per share of common stock $ 1.21 $ 1.04 16.3 % $ 2.39 $ 2.23 7.2 %
Diluted net earnings per share of common stock $ 1.19 $ 1.03 15.5 % $ 2.35 $ 2.20 6.8 %
Weighted-average shares outstanding:
Basic 373.9 373.9 373.9 373.7
Diluted 380.1 379.8 380.4 379.6


READ THE REST HERE


AMPLITUDE-1-123-1-1-1.jpg

July 27, 2018 OrthoSpineNews

July 26, 2018

VALENCE, France–(BUSINESS WIRE)–regulatory News:

Amplitude Surgical (Paris:AMPLI) (ISIN: FR0012789667, Ticker: AMPLI, PEA-PME eligible), a leading French player on the global surgical technology market for lower-limb orthopedics, today announces its sales for its 2017-18 financial year.

Olivier Jallabert, Chairman and CEO of Amplitude Surgical, says: “Exceeding €100 million in annual sales illustrates Amplitude Surgical’s positive momentum, with continuous organic growth since the Company’s creation in 1997. Our ongoing innovation strategy, our developments – notably on the major American market – and our solid financial structure will continue to drive our growth and our future economic and financial performances, our target being to double our sales in five years”.

Q4 2017-18 sales

30/06/2018 30/06/2017 Δ actual

Δ on a
comparable
basis*

€ thousands – IFRS
France 16,223 13,883 16.9% 7.8%
International 10,569 10,285 2.8% 9.4%
of which: Subsidiaries 7,118 7,400 -3.8% 5.3%
of which: Distributors 3,451 2,885 19.6% 19.7%
Total 26,791 24,168 10.9% 8.5%

FY 2017-18 sales

30/06/2018 30/06/2017 Δ actual Δ on a comparable basis*
€ thousands – IFRS
France 63,636 58,145 9.4% 7.2%
International 36,710 35,192 4.3% 9.8%
of which: Subsidiaries 26,633 25,380 4.9% 12.5%
of which: Distributors 10,077 9,812 2.7% 2.8%
Total 100,346 93,337 7.5% 8.2%

* constant currency and perimeter

During its 2017-18 financial year to June 30, 2018, Amplitude Surgical maintained a solid commercial momentum with sales totaling €100.3 million, up +7.5% in actual terms and +8.2% on a comparable basis (constant currency and perimeter).

Over the fourth quarter alone (April to June), sales totaled €26.8 million, up +10.9% in actual terms and +8.5% on a comparable basis.

On the French market, Amplitude Surgical recorded further solid growth with annual sales totaling €63.6 million, +9.4%, and fourth-quarter sales totaling €16.2 million, +16.9%. The strengthening of the teams, with the newly-acquired direct management of key territories in the East of the country and the Paris region leading to the recruitment of numerous surgeons, has enabled the Group to continue increasing its market share. The sales figure also benefited from the non-Group activity of the SOFAB industrial subsidiary, now completely consolidated.

Amplitude Surgical also continued to record strong international growth, with sales totaling €36.7 million over the year, up +9.8% at constant currency, notably thanks to the fine performance recorded by subsidiaries, which generated sales of €26.6 million, +12.5% at constant currency.

Over the financial year, the activity of the Group’s subsidiaries, which now account for 73% of international sales, beyond the French market, notably benefited from the dynamism of the Australian, Swiss and Benelux markets as well as the contribution of more than €2 million from the new subsidiaries in Japan and South Africa.

For the fourth year of marketing of Novastep’s products, innovative solutions for lower-limb (foot and ankle) surgery, sales totaled €6.6 million, up close to +9%, and accounted for 7% of Group sales with over 50% of its activity recorded abroad.

Good cash position at end-June

With cash and cash equivalents of almost €30 million at the end of its 2017/2018 financial year, Amplitude Surgical has the necessary means to finance its growth.

Recent highlights

  • Amplitude Surgical has just launched EVOK®, a cementless femoral stem. Having obtained CE marking, Amplitude Surgical will soon initiate the marketing of this high-added-value product;
  • In the United States, Amplitude Surgical has signed a contract with a distributor in Illinois. With more than 25 years of experience in the orthopedic industry and accompanied by 5 employees, this representative will quickly present Amplitude’s portfolio with the main users of the state;
  • On the industrial side, the new recently-certified white room delivered its first batches in June. It should be remembered that the insourcing of this key stage in the production process will have a positive impact on the Group’s EBITDA from the 2018-19 financial year.

Next financial press release: 2017-18 annual results, on Wednesday October 17, 2018, after market.

About Amplitude Surgical
Founded in 1997 in Valence, France, Amplitude Surgical is a leading French player on the global surgical technology market for lower-limb orthopedics. Amplitude Surgical develops and markets high-end products for orthopedic surgery covering the main disorders affecting the hip, knee and extremities, and notably foot and ankle surgery. Amplitude Surgical develops, in close collaboration with surgeons, numerous high value-added innovations in order to best meet the needs of patients, surgeons and healthcare facilities. A leading player in France, Amplitude Surgical is developing abroad through its subsidiaries and a network of exclusive distributors and agents distributing its products in more than 30 countries. Amplitude Surgical operates on the lower-limb market through the intermediary of its Novastep subsidiaries in France and the United States. At June 30, 2018, Amplitude Surgical had a workforce of nearly 400 employees and recorded sales of over 100 million euros.

Contacts

Amplitude Surgical
Philippe Garcia
CFO
finances@amplitude-surgical.com
+33 (0)4 75 41 87 41
or
NewCap
Investor Relations
Marc Willaume
amplitude@newcap.eu
+33 (0)1 44 71 00 13
or
NewCap
Media Relations
Nicolas Merigeau
amplitude@newcap.eu
+33 (0)1 44 71 98 55


6492704-1435765856-600x337-12bto-1.jpg

July 27, 2018 OrthoSpineNews

BY JOHN MURAWSKI / July 24, 2018

North Carolina’s largest health insurer is proposing a solution to control runaway health care costs: paying people to use cheaper doctors and procedures.

Blue Cross and Blue Shield will offer customers between $25 and $500 per medical procedure for more than 100 procedures. The amount of the rebate depends on the procedure’s complexity and the cost savings of the cheaper option.

A Blue Cross spokesman pointed out that picking a cheaper option is more valuable than just the cash rebate.

“There is also the big cost-saving potential where you can shop, find a high-quality provider, and really reduce your out-of-pocket costs,” said Blue Cross spokesman Austin Vevurka.

Insurers have for years sought to influence patient decisions through co-payments and high deductibles as a shared financial responsibility for medical costs. Blue Cross is taking the concept further by offering to share savings with the customer as a thank-you for reducing costs. In the past, this approach has been tried by financially rewarding doctors and hospitals for achieving cost savings.

Some health care experts are excited at the prospect of pulling back the veil on health care costs, saying that pricing transparency is long overdue. But others warn that using money to influence private medical decisions can be harmful, noting that not all doctors are equal.

“I would caution patients to be careful,” said Raleigh orthopedist Dr. Bradley Vaughn who operates at UNC Rex Hospital. “If someone saves $500 from a hip or knee replacement and suffers a serious complication, that $500 will be a drop in the bucket compared to all the misery they’ll experience.”


READ THE REST HERE


1491601885513-Y-1-1-1.png

July 27, 2018 OrthoSpineNews

WARSAW, Ind.July 27, 2018 /PRNewswire/ — Zimmer Biomet Holdings, Inc. (NYSE and SIX: ZBH) today reported financial results for the quarter ended June 30, 2018.  The Company reported second quarter net sales of $2.008 billion, an increase of 3.0% over the prior year period, and an increase of 1.0% on a constant currency basis.  Diluted earnings per share for the second quarter were $0.90, flat when compared to the prior year period.  Second quarter adjusted diluted earnings per share were $1.92, a decrease of 7.7% from the prior year period.

Bryan Hanson, President and CEO of Zimmer Biomet, said:  “Our achievements during the second quarter, including the improvement of our global Knee and Hip sales performance and ongoing growth within the Asia Pacific region, validate our confidence in our full-year outlook.  To continue building on our year-to-date progress, we will remain focused on strategies to support long-term, sustainable revenue growth and value-creation.  These priorities include the completion of quality remediation activities, supply recovery efforts, new product introductions and the continuous enhancement of our culture.”

Net earnings for the second quarter were $185.0 million, and $392.0 million on an adjusted basis.  Operating cash flow for the second quarter was $393.3 million.  Free cash flow in the quarter was $300.6 million.

In the quarter, the Company paid $48.8 million in dividends and declared a second quarter dividend of $0.24 per share.

Guidance

The Company is updating its full-year 2018 revenue guidance.  For the full year, the Company now expects revenue growth to be in a range of 1.0% to 2.5% compared to the prior year, including the positive contribution of between 100 and 150 basis points of foreign currency translation.  Additionally, the Company now expects its full-year free cash flow to be in a range of $1.2 billion to $1.35 billion (1).  All other prior guidance for 2018 remains unchanged.

(1)

Reconciliation of Projected Free Cash Flow for the Year Ending December 31, 2018

(in millions)

Low

High

Net Cash Provided by Operating Activities

$1,685

$1,805

Additions to Instruments and Other Property, Plant and Equipment

(485)

(455)

Free Cash Flow

$1,200

$1,350

Conference Call

The Company will conduct its second quarter 2018 investor conference call today, July 27, 2018, at 8:30 a.m. Eastern Time.  The audio webcast can be accessed via Zimmer Biomet’s Investor Relations website at http://investor.zimmerbiomet.com.  It will be archived for replay following the conference call.

Individuals in the U.S. and Canada who wish to dial into the conference call may do so by dialing (888) 312-9837 and entering conference ID 7278985.  For a complete listing of international toll-free and local numbers, please visit http://investor.zimmerbiomet.com.  A digital recording will be available 24 hours after the completion of the conference call, from July 28, 2018 to August 27, 2018.  To access the recording, U.S. callers should dial (888) 203-1112 and international callers should dial +1 (719) 457-0820 and enter the Access Code ID 7278985.

Sales Tables

The following sales tables provide results by geography and product category, as well as the percentage change compared to the prior year quarter and six months, on both a reported basis and a constant currency basis.

NET SALES – THREE MONTHS ENDED JUNE 30, 2018

(in millions, unaudited)

Constant

Net

Currency

Sales

% Change

% Change

Geographic Results

Americas

$

1,216

1.0

%

0.9

%

EMEA

458

4.4

(1.8)

Asia Pacific

334

8.5

5.4

Total

$

2,008

3.0

%

1.0

%

Product Categories

Knees

Americas

$

408

0.7

%

0.5

%

EMEA

171

7.0

1.1

Asia Pacific

124

8.1

5.1

Total

703

3.4

1.4

Hips

Americas

250

2.7

2.5

EMEA

134

2.2

(3.8)

Asia Pacific

103

9.9

6.5

Total

487

4.0

1.5

S.E.T *

434

3.0

1.2

Dental

107

(3.2)

(5.5)

Spine & CMF**

198

2.5

1.3

Other

79

2.8

1.2

Total

$

2,008

3.0

%

1.0

%

* Surgical, Sports Medicine, Foot and Ankle, Extremities and Trauma

** Craniomaxillofacial

NET SALES – SIX MONTHS ENDED JUNE 30, 2018

(in millions, unaudited)

Constant

Net

Currency

Sales

% Change

% Change

Geographic Results

Americas

$

2,424

(0.4)

%

(0.6)

%

EMEA

954

7.0

(2.4)

Asia Pacific

647

8.4

4.0

Total

$

4,025

2.6

%

(0.3)

%

Product Categories

Knees

Americas

$

825

(1.0)

%

(1.1)

%

EMEA

360

9.8

0.5

Asia Pacific

231

5.3

1.2

Total

1,416

2.6

(0.4)

Hips

Americas

$

498

2.0

1.7

EMEA

276

3.4

(5.7)

Asia Pacific

205

9.7

5.0

Total

979

3.9

0.3

S.E.T *

876

3.7

1.2

Dental

215

(1.7)

(5.1)

Spine & CMF**

381

0.5

(1.2)

Other

158

0.8

(1.5)

Total

$

4,025

2.6

%

(0.3)

%

* Surgical, Sports Medicine, Foot and Ankle, Extremities and Trauma

** Craniomaxillofacial


 About the Company

Founded in 1927 and headquartered in Warsaw, Indiana, Zimmer Biomet is a global leader in musculoskeletal healthcare. We design, manufacture and market orthopaedic reconstructive products; sports medicine, biologics, extremities and trauma products; office based technologies; spine, craniomaxillofacial and thoracic products; dental implants; and related surgical products.

We collaborate with healthcare professionals around the globe to advance the pace of innovation. Our products and solutions help treat patients suffering from disorders of, or injuries to, bones, joints or supporting soft tissues. Together with healthcare professionals, we help millions of people live better lives.

We have operations in more than 25 countries around the world and sell products in more than 100 countries. For more information, visit www.zimmerbiomet.com or follow Zimmer Biomet on Twitter at www.twitter.com/zimmerbiomet.

Website Information

We routinely post important information for investors on our website, www.zimmerbiomet.com, in the “Investor Relations” section.  We use this website as a means of disclosing material, non-public information and for complying with our disclosure obligations under Regulation FD.  Accordingly, investors should monitor the Investor Relations section of our website, in addition to following our press releases, SEC filings, public conference calls, presentations and webcasts.  The information contained on, or that may be accessed through, our website is not incorporated by reference into, and is not a part of, this document.

Reclassifications

Beginning this quarter, in our consolidated statements of earnings we have reclassified expenses that were previously recognized in a financial statement line item labeled, “Acquisition, quality remediation and other” to the financial statement line items of “Research and development”, “Selling, general and administrative”, “Intangible asset impairment”, “Acquisition, integration and related”, and “Quality remediation”.  Prior periods have been reclassified to conform to the current year presentation.

Note on Non-GAAP Financial Measures

This press release includes non-GAAP financial measures that differ from financial measures calculated in accordance with U.S. generally accepted accounting principles (“GAAP”).  These non-GAAP financial measures may not be comparable to similar measures reported by other companies and should be considered in addition to, and not as a substitute for, or superior to, other measures prepared in accordance with GAAP.

Sales change information for the three and six-month periods ended June 30, 2018 are presented on a GAAP (reported) basis and on a constant currency basis.  Constant currency percentage changes exclude the effects of foreign currency exchange rates.  They are calculated by translating current and prior-period sales at the same predetermined exchange rate.  The translated results are then used to determine year-over-year percentage increases or decreases.

Net earnings and diluted earnings per share for the three and six-month periods ended June 30, 2018 are presented on a GAAP (reported) basis and on an adjusted basis.  Adjusted earnings and adjusted diluted earnings per share exclude the effects of inventory step-up; certain inventory and manufacturing-related charges including charges to discontinue certain product lines; intangible asset amortization; intangible asset impairment; acquisition, integration and related expenses; quality remediation expenses; certain litigation gains and charges; other charges; and any related effects on our income tax provision associated with these items; and other certain tax adjustments.

Free cash flow and projected free cash flow are additional non-GAAP measures that are presented in this press release. Free cash flow is computed by deducting additions to instruments and other property, plant and equipment from net cash provided by operating activities.

Reconciliations of these non-GAAP financial measures to the most directly comparable GAAP financial measures are included in this press release. This press release also contains supplemental reconciliations of additional non-GAAP financial measures that the Company presents in other contexts. These additional non-GAAP financial measures are computed from the most directly comparable GAAP financial measure as indicated in the applicable reconciliation.

Management uses non-GAAP financial measures internally to evaluate the performance of the business.  Additionally, management believes these non-GAAP measures provide meaningful incremental information to investors to consider when evaluating the performance of the Company.  Management believes these measures offer the ability to make period-to-period comparisons that are not impacted by certain items that can cause dramatic changes in reported income but that do not impact the fundamentals of our operations.  The non-GAAP measures enable the evaluation of operating results and trend analysis by allowing a reader to better identify operating trends that may otherwise be masked or distorted by these types of items that are excluded from the non-GAAP measures.  In addition, constant currency sales changes, adjusted operating profit, adjusted diluted net earnings per share and free cash flow are used as performance metrics in our incentive compensation programs.

Cautionary Statement Regarding Forward-Looking Statements

This release contains forward-looking statements within the meaning of the safe harbor provisions of the Private Securities Litigation Reform Act of 1995, including, among others, statements regarding sales and earnings guidance and any statements about our expectations, plans, strategies or prospects.   We generally use the words “may,” “will,” “expects,” “believes,” “anticipates,” “plans,” “estimates,” “projects,” “assumes,” “guides,” “targets,” “forecasts,” “sees,” “seeks,” “should,” “could,” “intends” and similar expressions to identify forward-looking statements.   All statements other than statements of historical or current fact are, or may be deemed to be, forward-looking statements.   Such statements are based upon the current beliefs and expectations of management and are subject to significant risks, uncertainties and changes in circumstances that could cause actual outcomes and results to differ materially.  These risks, uncertainties and changes in circumstances include, but are not limited to:  our chief executive officer transition, including disruptions and uncertainties related thereto, the potential impact on our business and future strategic direction resulting from our transition to a new chief executive officer, and our ability to recruit and retain other key members of senior management; the possibility that the anticipated synergies and other benefits from mergers and acquisitions will not be realized, or will not be realized within the expected time periods; the risks and uncertainties related to our ability to successfully integrate the operations, products, employees and distributors of acquired companies; the effect of the potential disruption of management’s attention from ongoing business operations due to integration matters related to mergers and acquisitions; the effect of mergers and acquisitions on our relationships with customers, vendors and lenders and on our operating results and businesses generally; compliance with the Deferred Prosecution Agreement entered into in January 2017; the success of our quality and operational excellence initiatives, including ongoing quality remediation efforts at our Warsaw North Campus facility; challenges relating to changes in and compliance with governmental laws and regulations affecting our U.S. and international businesses, including regulations of the U.S. Food and Drug Administration (FDA) and foreign government regulators, such as more stringent requirements for regulatory clearance of products; the ability to remediate matters identified in any inspectional observations or warning letters issued by the FDA, while continuing to satisfy the demand for our products; the outcome of government investigations; competition; pricing pressures; changes in customer demand for our products and services caused by demographic changes or other factors; the impact of healthcare reform measures; reductions in reimbursement levels by third-party payors and cost containment efforts of healthcare purchasing organizations; dependence on new product development, technological advances and innovation; shifts in the product category or regional sales mix of our products and services; supply and prices of raw materials and products; control of costs and expenses; the ability to obtain and maintain adequate intellectual property protection; the ability to form and implement alliances; changes in tax obligations arising from tax reform measures, including European Union rules on state aid, or examinations by tax authorities; product liability and intellectual property litigation losses; the ability to retain the independent agents and distributors who market our products; dependence on a limited number of suppliers for key raw materials and outsourced activities; changes in general industry and market conditions, including domestic and international growth rates; changes in general domestic and international economic conditions, including interest rate and currency exchange rate fluctuations; and the impact of the ongoing financial and political uncertainty on countries in the Euro zone on the ability to collect accounts receivable in affected countries.  For a further list and description of such risks and uncertainties, see our reports filed with the U.S. Securities and Exchange Commission (SEC), including our Annual Report on Form 10-K for the year ended December 31, 2017.  Copies of these filings, as well as subsequent filings, are available online at www.sec.govwww.zimmerbiomet.com or on request from us.  Forward-looking statements speak only as of the date they are made, and we disclaim any intention or obligation to update or revise any forward-looking statements, whether as a result of new information, future events or otherwise.  Readers of this release are cautioned not to rely on these forward-looking statements, since there can be no assurance that these forward-looking statements will prove to be accurate.  This cautionary statement is applicable to all forward-looking statements contained in this release.

ZIMMER BIOMET HOLDINGS, INC.

CONSOLIDATED STATEMENTS OF EARNINGS

FOR THE THREE MONTHS ENDED JUNE 30, 2018 and 2017

(in millions, except per share amounts, unaudited)

2018

2017

Net Sales

$

2,007.6

$

1,949.5

Cost of products sold, excluding intangible asset amortization

583.7

527.7

Intangible asset amortization

149.5

147.7

Research and development

99.1

92.6

Selling, general and administrative

791.3

752.2

Intangible asset impairment

26.8

Acquisition, integration and related

50.5

72.5

Quality remediation

37.5

49.9

Operating expenses

1,711.6

1,669.4

Operating Profit

296.0

280.1

Other expense, net

(2.9)

(1.7)

Interest income

0.6

0.3

Interest expense

(75.9)

(82.3)

Earnings before income taxes

217.8

196.4

Provision for income taxes

32.9

12.3

Net Earnings

184.9

184.1

Less: Net Loss attributable to noncontrolling interest

(0.1)

(0.1)

Net Earnings of Zimmer Biomet Holdings, Inc.

$

185.0

$

184.2

Earnings Per Common Share

Basic

$

0.91

$

0.91

Diluted

$

0.90

$

0.90

Weighted Average Common Shares Outstanding

Basic

203.3

201.8

Diluted

204.6

203.7

Cash Dividends Declared Per Common Share

$

0.24

$

0.24


READ THE REST HERE