
July 28, 2017 OrthoSpineNews
|
| Contact Information |
| Orchid Abbie Woolston 517-694-2300 Contact www.orchid-ortho.com |
|
| Contact Information |
| Orchid Abbie Woolston 517-694-2300 Contact www.orchid-ortho.com |
July 27, 2017
GAINESVILLE, Fla.–(BUSINESS WIRE)–Exactech, Inc. (Nasdaq:EXAC), a developer and producer of bone and joint restoration products and biologic solutions for extremities, knee and hip, announced today that revenue for the second quarter of 2017 increased 2% to $67.3 million from $66.1 million in the second quarter of 2016, and 3% on a constant currency basis. Domestic revenue increased 2% to $45.7 million, and international revenue increased 1% to $21.6 million in the second quarter of 2017. Diluted earnings per share for the second quarter was $0.33 based on net income of $4.8 million, compared to second quarter 2016 net income of $4.4 million and diluted earnings per share of $0.31.
Second Quarter Segment Performance
Six Months Highlights and Segment Performance
For the first six months of 2017, revenue was $136.8 million, an increase of 4% over $131.4 million for the comparable period last year. On a constant currency basis, revenue for the first half of 2017 was up 5%. Net income for the first six months of 2017 increased 7% to $9.4 million, or $0.65 per diluted share compared to $8.8 million, or $0.62 per diluted share, for the first six months of 2016. First six month product revenue was as follows:
Management Comment
Exactech CEO and President David Petty said, “For the first half of 2017, we reported a 4% increase in our revenue; however, excluding the impact of the divested spine products from the prior year we reported 7% growth in revenue during the first half of the year. Our hip revenue was negatively impacted by distribution transitions underway in certain markets outside the U.S. We continue to be pleased with the performance of our Extremities segment, which benefited modestly in the quarter from the pilot launch of the Vantage® ankle and also the Equinoxe® Preserve humeral stem. In terms of our product pipeline, additional pilot launches of the ExactechGPS® shoulder application, Alteon® H.A. hip stem and the Truliant® knee system are also going well.
“During the third and fourth quarters we will be building inventory for these systems and hope to move into a limited launch late this year. Our channel development strategy remains important and will be enhanced as we more fully launch the Truliant knee system,” Petty said.
Chief Financial Officer Jody Phillips said, “Gross margins decreased to 68.7% from 69.3% for the second quarter a year ago, as average selling price decreases offset the increases in higher margin extremity sales. Total operating expenses for the quarter remained relatively flat at $39.3 million due to the divestiture of the spine segment being offset by an increase in product launch and development expenses. As a result, we produced a net income increase of 10% to $4.8 million and $0.33 diluted EPS for the second quarter which was in the range of our expectations.”
Looking forward, Exactech narrowed 2017 revenue guidance to $267-$271 million and diluted EPS target to $1.25-$1.29, including the impact of the first quarter $0.02 diluted earnings per share costs related to the spine business transition. On an adjusted basis, the diluted EPS target is $1.27-$1.31. For the third quarter of 2017, the company anticipates revenues of $60.5-$62.5 million and diluted EPS of $0.23-$0.25. The foregoing statements regarding targets for the quarter and full year are forward-looking and actual results may differ materially. These are the company’s targets, not predictions of actual performance.
The financial statements are below.
Conference Call
The company will hold a conference call with CEO David Petty and key members of the management team, Friday, July 28th at 10:00 a.m. Eastern Time. The call will cover Exactech’s second quarter 2017 results. Mr. Petty will open the conference call and a question-and-answer session will follow.
To participate in the call, dial 888-417-2254 any time after 9:50 a.m. Eastern Time on July 28. International and local callers should dial 719-325-4790. A live webcast of the call will be available at http://www.hawkassociates.com/profile/exac.cfm or
http://public.viavid.com/index.php?id=125497.
About Exactech
Based in Gainesville, Fla., Exactech develops and markets orthopaedic implant devices, related surgical instruments and biologic materials and services to hospitals and physicians. The company manufactures many of its orthopaedic devices at its Gainesville facility. Exactech’s orthopaedic products are used in the restoration of bones and joints that have deteriorated as a result of injury or diseases such as arthritis. Exactech markets its products in the United States, in addition to more than 30 markets in Europe, Latin America, Asia and the Pacific. Additional information about Exactech, Inc. can be found at http://www.exac.com. Copies of Exactech’s press releases, SEC filings, current price quotes and other valuable information for investors may be found at http://www.exac.com and http://www.hawkassociates.com.
An investment profile on Exactech may be found at http://www.hawkassociates.com/profile/exac.cfm. To receive future releases in e-mail alerts, sign up at http://www.hawkassociates.com/about/alert.
This release contains various forward-looking statements within the meaning of Section 27A of the Securities Act of 1933 and Section 21E of the Securities Exchange Act of 1934, which represent the company’s expectations or beliefs concerning future events of the company’s financial performance. These forward-looking statements are further qualified by important factors that could cause actual results to differ materially from those in the forward-looking statements. These factors include the effect of competitive pricing, the company’s dependence on the ability of third party manufacturers to produce components on a basis which is cost-effective to the company, market acceptance of the company’s products and the effects of government regulation. Results actually achieved may differ materially from expected results included in these statements.
|
EXACTECH, INC. AND SUBSIDIARIES |
|||||||||||||
| CONSOLIDATED BALANCE SHEETS | |||||||||||||
| (in thousands) | |||||||||||||
| (unaudited) | (audited) | ||||||||||||
| June 30, | December 31, | ||||||||||||
| 2017 | 2016 | ||||||||||||
| ASSETS | |||||||||||||
| CURRENT ASSETS: | |||||||||||||
| Cash and cash equivalents | $ | 8,917 | $ | 13,052 | |||||||||
| Trade receivables, net of allowances of $1,707 and $1,473 | 57,733 | 53,051 | |||||||||||
| Prepaid expenses and other assets, net | 3,606 | 3,075 | |||||||||||
| Income taxes receivable | 1,848 | 2,140 | |||||||||||
| Inventories, current | 67,358 | 65,264 | |||||||||||
| Assets held for sale | 2,695 | 6,477 | |||||||||||
| Total current assets | 142,157 | 143,059 | |||||||||||
| PROPERTY AND EQUIPMENT: | |||||||||||||
| Land | 4,530 | 4,474 | |||||||||||
| Machinery and equipment | 43,033 | 42,034 | |||||||||||
| Surgical instruments | 144,018 | 132,134 | |||||||||||
| Furniture and fixtures | 4,713 | 4,700 | |||||||||||
| Facilities | 21,690 | 21,726 | |||||||||||
| Projects in process | 6,818 | 2,473 | |||||||||||
| Total property and equipment | 224,802 | 207,541 | |||||||||||
| Accumulated depreciation | (108,160 | ) | (100,234 | ) | |||||||||
| Net property and equipment | 116,642 | 107,307 | |||||||||||
| OTHER ASSETS: | |||||||||||||
| Deferred financing, deposits and other | 4,326 | 968 | |||||||||||
| Equity investment | 1,952 | 2,047 | |||||||||||
| Deferred tax asset | — | 887 | |||||||||||
| Non-current inventory | 11,823 | 15,723 | |||||||||||
| Product licenses and designs, net | 8,933 | 9,102 | |||||||||||
| Patents and trademarks, net | 717 | 821 | |||||||||||
| Customer relationships, net | 467 | 476 | |||||||||||
| Goodwill | 14,758 | 13,819 | |||||||||||
| Total other assets | 42,976 | 43,843 | |||||||||||
| TOTAL ASSETS | $ | 301,775 | $ | 294,209 | |||||||||
| LIABILITIES AND SHAREHOLDERS’ EQUITY | |||||||||||||
| CURRENT LIABILITIES: | |||||||||||||
| Accounts payable | $ | 16,602 | $ | 17,566 | |||||||||
| Income taxes payable | 1,772 | 780 | |||||||||||
| Accrued expenses | 13,017 | 11,832 | |||||||||||
| Liabilities held for sale | 325 | — | |||||||||||
| Other current liabilities | 2,884 | 2,927 | |||||||||||
| Total current liabilities | 34,600 | 33,105 | |||||||||||
| LONG-TERM LIABILITIES: | |||||||||||||
| Deferred tax liabilities | 3,243 | 1,773 | |||||||||||
| Long-term debt, net of current portion | 14,000 | 20,000 | |||||||||||
| Other long-term liabilities | 3,152 | 5,089 | |||||||||||
| Total long-term liabilities | 20,395 | 26,862 | |||||||||||
| Total liabilities | 54,995 | 59,967 | |||||||||||
| COMMITMENTS AND CONTINGENCIES | |||||||||||||
| SHAREHOLDERS’ EQUITY: | |||||||||||||
| Common stock | 145 | 144 | |||||||||||
| Additional paid-in capital | 90,228 | 87,319 | |||||||||||
| Treasury Stock | (3,042 | ) | (3,042 | ) | |||||||||
| Accumulated other comprehensive loss, net of tax | (8,398 | ) | (8,611 | ) | |||||||||
| Retained earnings | 167,847 | 158,432 | |||||||||||
| Total shareholders’ equity | 246,780 | 234,242 | |||||||||||
| TOTAL LIABILITIES AND SHAREHOLDERS’ EQUITY | $ | 301,775 | $ | 294,209 | |||||||||
|
EXACTECH, INC. AND SUBSIDIARIES |
||||||||||||||||||||
| CONDENSED CONSOLIDATED STATEMENTS OF INCOME | ||||||||||||||||||||
| (in thousands, except per share amounts) | ||||||||||||||||||||
| (Unaudited) | ||||||||||||||||||||
| Three Month Periods | Six Month Periods | |||||||||||||||||||
| Ended June 30, | Ended June 30, | |||||||||||||||||||
| 2017 | 2016 | 2017 | 2016 | |||||||||||||||||
| NET SALES | $ | 67,327 | $ | 66,124 | $ | 136,809 | $ | 131,422 | ||||||||||||
| COST OF GOODS SOLD | 21,054 | 20,268 | 41,695 | 40,636 | ||||||||||||||||
| Gross profit | 46,273 | 45,856 | 95,114 | 90,786 | ||||||||||||||||
| OPERATING EXPENSES: | ||||||||||||||||||||
| Sales and marketing | 23,569 | 23,835 | 48,622 | 47,154 | ||||||||||||||||
| General and administrative | 5,621 | 5,640 | 12,157 | 11,554 | ||||||||||||||||
| Research and development | 5,380 | 5,329 | 11,604 | 10,399 | ||||||||||||||||
| Depreciation and amortization | 4,732 | 4,410 | 9,391 | 8,734 | ||||||||||||||||
| Total operating expenses | 39,302 | 39,214 | 81,774 | 77,841 | ||||||||||||||||
| INCOME FROM OPERATIONS | 6,971 | 6,642 | 13,340 | 12,945 | ||||||||||||||||
| OTHER INCOME (EXPENSE): | ||||||||||||||||||||
| Interest income | 52 | 2 | 55 | 6 | ||||||||||||||||
| Other income (loss) | 185 | 32 | 328 | 72 | ||||||||||||||||
| Interest expense | (238 | ) | (268 | ) | (464 | ) | (530 | ) | ||||||||||||
| Foreign currency exchange gain | 168 | 98 | 730 | 592 | ||||||||||||||||
| Total other income (expenses) | 167 | (136 | ) | 649 | 140 | |||||||||||||||
| INCOME BEFORE INCOME TAXES | 7,138 | 6,506 | 13,989 | 13,085 | ||||||||||||||||
| PROVISION FOR INCOME TAXES | 2,255 | 2,120 | 4,479 | 4,297 | ||||||||||||||||
| INCOME BEFORE EQUITY IN LOSS OF INVESTEE | 4,883 | 4,386 | 9,510 | 8,788 | ||||||||||||||||
| EQUITY IN LOSS OF INVESTEE, NET OF TAX | (52 | ) | — | (95 | ) | — | ||||||||||||||
| NET INCOME | $ | 4,831 | $ | 4,386 | $ | 9,415 | $ | 8,788 | ||||||||||||
| BASIC EARNINGS PER SHARE | $ | 0.34 | $ | 0.31 | $ | 0.66 | $ | 0.62 | ||||||||||||
| DILUTED EARNINGS PER SHARE | $ | 0.33 | $ | 0.31 | $ | 0.65 | $ | 0.62 | ||||||||||||
| SHARES – BASIC | 14,321 | 14,112 | 14,297 | 14,084 | ||||||||||||||||
| SHARES – DILUTED | 14,574 | 14,298 | 14,513 | 14,243 | ||||||||||||||||
Non-GAAP Disclosure and Reconciliation
We present certain non-GAAP results as a supplement to our financial results based on GAAP, as we believe it is useful to exclude certain items in order to focus on what we regard to be a more reliable indicator of the underlying operating performance of our business. Because we operate internationally, we present the percentage change in sales by reporting segment on a constant currency basis, which is a non-GAAP financial measure. We calculate this change on a constant currency basis by translating current period sales at the comparable average historical exchange rates for the same period in the prior year. We believe that presenting the percentage change in sales on a constant currency basis assists in the understanding of actual sales fluctuations by excluding the impact of foreign currency fluctuations.
Additionally, we report on a non-GAAP basis adjusted sales, gross margin, operating expenses, income, and diluted earnings per share excluding charges related to the spine assets we sold January 2017. We believe the exclusion of spine sales and costs provides the reader with more comparable financials to better analyze the reported periods. The following items have been adjusted:
| Six Months June 30, 2017 | Six Months June 30, 2016 | Change % | |||||||||||||||||||||
| Reported | US Spine | Adjusted | Reported | US Spine | Adjusted | Reported | Adjusted | ||||||||||||||||
| Domestic sales | $ | 93,355 | $ | 282 | $ | 93,073 | $ | 89,185 | $ | 3,758 | 85,427 | ||||||||||||
| International sales | 43,454 | — | 43,454 | 42,237 | — | 42,237 | |||||||||||||||||
| Total sales | 136,809 | 282 | 136,527 | 131,422 | 3,758 | 127,664 | 4.1% | 6.9% | |||||||||||||||
| Gross profit | 95,114 | 187 | 94,927 | 90,786 | 1,700 | 89,086 | 4.8 | 6.6 | |||||||||||||||
| Operating expense | 81,774 | 715 | 81,059 | 77,841 | 1,886 | 75,955 | 5.1 | 6.7 | |||||||||||||||
| Other income | 649 | — | 649 | 140 | — | 140 | 363.6 | 363.6 | |||||||||||||||
| Income before income tax and equity in loss of investee | 13,989 | (528 | ) | 14,517 | 13,085 | (186 | ) | 13,271 | 6.9 | 9.4 | |||||||||||||
| Income tax | 4,479 | (140 | ) | 4,619 | 4,297 | (67 | ) | 4,364 | 4.2 | 5.9 | |||||||||||||
| Equity in loss of investee | (95 | ) | — | (95 |
) |
|
— |
— | — | ||||||||||||||
| Net income (loss) | $ | 9,415 | $ | (388 | ) | $ | 9,803 | $ | 8,788 | $ | (119 | ) | $ | 8,907 | 7.1 | 10.1 | |||||||
| Diluted EPS | $ | 0.65 | $ | (0.03 | ) | $ | 0.68 | $ | 0.62 | $ | (0.01 | ) | $ | 0.63 | |||||||||
We also provide adjusted forward looking guidance on diluted earnings per share for the full year for 2017. We believe this adjusted guidance will assist in comparative measures. The following reconciles the guidance ranges to expected guidance on a GAAP basis:
| Twelve Months Ended | ||||||||||||
| December 31, 2017 | ||||||||||||
| Expected diluted EPS range on GAAP basis | $1.25 – $1.29 | |||||||||||
| Adjustment: Spine asset divestiture | 0.02 | |||||||||||
| Adjusted total diluted EPS range | $1.27-$1.31 |
Exactech, Inc.
Investor contacts
Jody Phillips, 352-377-1140
Executive Vice President of Finance &
Chief Financial Officer
or
Hawk Associates
Julie Marshall or Frank Hawkins, 305-451-1888
EXAC@hawkassociates.com
or
Exactech, Inc.
Media contact
Priscilla Bennett, 352-377-1140
Vice President, Corporate & Marketing Communication
SAN DIEGO, July 27, 2017 /PRNewswire/ — NuVasive, Inc. (Nasdaq: NUVA), a leading medical device company focused on transforming spine surgery with minimally disruptive, procedurally-integrated solutions, announced today financial results for the quarter ended June 30, 2017.
Second Quarter 2017 Highlights
“NuVasive delivered better than expected operating profitability and earnings per share results in the second quarter 2017, along with continued strength across our International business, growing at more than 20% for the third quarter in a row,” said Gregory T. Lucier, chairman and chief executive officer of NuVasive. “In addition, several of our industry-disrupting technologies completed alpha and beta testing this quarter and will commercially launch over the next few months, giving surgeons and patients access to some of the most innovative technologies to address spine and trauma conditions, as well as radiation reduction in the operating room.”
A full reconciliation of GAAP to non-GAAP measures can be found in the tables of this news release.
Second Quarter 2017 Results
NuVasive reported second quarter 2017 total revenue of $260.6 million, a 10.3% increase compared to $236.2 million for the second quarter 2016. On a constant currency basis, second quarter 2017 total revenue increased 10.7% compared to the same period last year.
For the second quarter 2017, both GAAP and non-GAAP gross profit was $194.2 million, while both GAAP and non-GAAP gross margin was 74.5%. These results compared to GAAP and non-GAAP gross profit of $176.5 million and $183.8 million, respectively, and GAAP and non-GAAP gross margin of 74.7% and 77.8% respectively, for the second quarter 2016. Total GAAP and non-GAAP operating expenses were $164.4 million and $151.7 million, respectively, for the second quarter 2017. These results compared to GAAP and non-GAAP operating expenses of $116.4 million and $146.4 million, respectively, for the second quarter 2016.
NuVasive reported a GAAP net income of $12.7 million, or $0.22 per share, for the second quarter 2017 compared to $30.2 million, or $0.57 per share, for the second quarter 2016.
On a non-GAAP basis, the Company reported net income of $24.1 million, or $0.46 per share for the second quarter 2017 compared to $20.6 million, or $0.40 per share, for the second quarter 2016.
Cash, cash equivalents and short and long-term marketable securities were approximately $130.9 million at June 30, 2017.
Annual Guidance for 2017
The Company reiterated full year 2017 financial guidance in line with prior expectations, with the exception of the impact of updated foreign exchange rates.
|
2017 Guidance 1 |
|||||
|
(in Million’s; except %’s and EPS) |
GAAP |
Non-GAAP |
|||
|
Revenue |
$ 1,065 |
$ 1,065 |
|||
|
% Growth – Reported |
10.7% |
10.7% |
|||
|
% Growth – Constant Currency 2 |
11.1% |
||||
|
Operating margin |
12.4% |
17.1% |
|||
|
Earnings per share |
$ 1.13 |
$ 2.00 |
|||
|
EBITDA |
23.6% |
26.7% |
|||
|
Tax Rate |
~33% |
~35% |
|||
|
1 |
Current guidance reflects guidance provided July 27, 2017. |
||||
|
2 |
Constant currency is a measure that adjusts US GAAP revenue for |
||||
Supplementary Financial Information
For additional financial detail, please visit the Investor Relations section at www.nuvasive.com to access Supplementary Financial Information.
|
Reconciliation of Full Year EPS Guidance |
|||||||
|
2017 Guidance |
|||||||
|
2016 |
Prior 1, 2 |
Current 1, 3 |
|||||
|
GAAP net income per share |
$ 0.69 |
$ 1.13 |
$ 1.13 |
||||
|
Impact of change to diluted share count |
0.02 |
0.07 |
0.09 |
||||
|
GAAP net income per share, adjusted to diluted Non-GAAP share count |
$ 0.71 |
$ 1.20 |
$ 1.22 |
||||
|
Litigation liability gain |
(0.83) |
– |
– |
||||
|
Business transition costs 4 |
0.35 |
0.04 |
0.05 |
||||
|
Non-cash interest expense on convertible notes |
0.38 |
0.33 |
0.33 |
||||
|
Non-cash purchase accounting adjustments on acquisitions 5 |
0.28 |
– |
– |
||||
|
Loss on repurchase of convertible notes |
0.37 |
– |
– |
||||
|
Amortization of intangible assets 6 |
0.78 |
0.89 |
0.88 |
||||
|
Tax effect of adjustments 7 |
(0.38) |
(0.46) |
(0.48) |
||||
|
Non-GAAP earnings per share |
$ 1.66 |
$ 2.00 |
$ 2.00 |
||||
|
GAAP Weighted shares outstanding – basic |
50,077 |
50,967 |
50,864 |
||||
|
GAAP Weighted shares outstanding – diluted |
54,102 |
56,269 |
56,617 |
||||
|
Non-GAAP Weighted shares outstanding – diluted |
51,981 |
53,069 |
52,738 |
||||
|
1 |
Prior guidance provided April 25, 2017. Current guidance reflects guidance provided July 27, 2017. |
||||||
|
2 |
Effective tax expense rate of ~34% applied to GAAP earnings and ~35% applied to Non-GAAP earnings. |
||||||
|
3 |
Effective tax expense rate of ~33% applied to GAAP earnings and ~35% applied to Non-GAAP earnings. |
||||||
|
4 |
Costs related to acquisition, integration and business transition activities which include severance, relocation, consulting, leasehold exit costs, third party merger and acquisitions costs and other costs directly associated with such activities. |
||||||
|
5 |
Represents costs associated with non-cash purchase accounting adjustments, such as acquired inventory fair market value adjustments, which are amortized over the period in which underlying products are sold. |
||||||
|
6 |
Excludes the amortization associated with non-controlling interest. |
||||||
|
7 |
The impact on results from taxes include tax effecting the adjustments above at the statutory rate as well as taking into account discrete items and including those discrete items in the annual effective tax rate calculation. The Company also includes those adjustments that would have benefited the tax rate in lieu of the above adjustments as part of the Company’s tax filings. The impact of the changes to the tax rate results in an annual estimated rate of ~35% on a non-GAAP basis. |
||||||
|
Reconciliation of Non-GAAP Operating Margin % |
||||||||
|
2017 Guidance |
||||||||
|
(in thousands, except %) |
2016 |
Prior 1 |
Current 1 |
|||||
|
Non-GAAP Gross Margin %[A] |
76.6% |
76.1% |
75.6% |
|||||
|
Non-cash purchase accounting adjustments on acquisitions 2 |
(1.5%) |
0.0% |
0.0% |
|||||
|
GAAP Gross Margin [B] |
75.0% |
76.1% |
75.6% |
|||||
|
GAAP & Non-GAAP Sales, Marketing & Administrative Expense [C] |
55.5% |
54.0% |
53.5% |
|||||
|
Non-GAAP Research & Development Expense [D] |
5.0% |
5.0% |
5.0% |
|||||
|
In-process research & development |
0.0% |
0.0% |
0.0% |
|||||
|
GAAP Research & Development Expense [E] |
5.0% |
5.0% |
5.0% |
|||||
|
Litigation liability [F] |
(4.5%) |
0.0% |
0.0% |
|||||
|
Amortization of intangible assets [G] 3 |
4.4% |
4.6% |
4.5% |
|||||
|
Business transition costs [H] 4 |
1.9% |
0.2% |
0.2% |
|||||
|
Non-GAAP Operating Margin % [A – C – D] |
16.1% |
17.1% |
17.1% |
|||||
|
GAAP Operating Margin % [B – C – E – F – G – H] |
12.8% |
12.3% |
12.4% |
|||||
|
1 |
Prior guidance provided April 25, 2017. Current guidance reflects guidance provided July 27, 2017. |
|||||||
|
2 |
Represents costs associated with non-cash purchase accounting adjustments, such as acquired inventory fair market value adjustments, which are amortized over the period in which underlying products are sold. |
|||||||
|
3 |
Excludes the amortization associated with non-controlling interest. |
|||||||
|
4 |
Costs related to acquisition, integration and business transition activities which include severance, relocation, consulting, leasehold exit costs, third party merger and acquisitions costs and other costs directly associated with such activities. |
|||||||
|
Reconciliation of EBITDA % |
|||||||
|
2017 Guidance |
|||||||
|
(in thousands, except %) |
2016 |
Prior 1 |
Current 1 |
||||
|
Net Income / (Loss) |
3.9% |
6.0% |
6.0% |
||||
|
Interest (income) / expense, net 2 |
6.1% |
3.5% |
3.6% |
||||
|
Provision for income taxes |
3.0% |
3.0% |
2.9% |
||||
|
Depreciation and amortization 3 |
10.5% |
11.1% |
11.0% |
||||
|
EBITDA |
23.5% |
23.6% |
23.6% |
||||
|
Non-cash stock based compensation |
2.8% |
3.0% |
3.0% |
||||
|
Business transition costs 4 |
1.9% |
0.2% |
0.2% |
||||
|
Non-cash purchase accounting adjustments on acquisitions 5 |
1.5% |
0.0% |
0.0% |
||||
|
In-process research & development |
0.0% |
0.0% |
0.0% |
||||
|
Litigation liability gain |
(4.5%) |
0.0% |
0.0% |
||||
|
Adjusted EBITDA |
25.2% |
26.7% |
26.7% |
||||
|
1 |
Prior guidance provided April 25, 2017. Current guidance reflects guidance provided July 27, 2017. |
||||||
|
2 |
Interest (income) / expense, net for the quarter and year ended December 31, 2016 includes loss on extinguishment of debt for $1.6 million and $19.1 million, respectively. |
||||||
|
3 |
Excludes the amortization associated with non-controlling interest. |
||||||
|
4 |
Costs related to acquisition, integration and business transition activities which include severance, relocation, consulting, leasehold exit costs, third party merger and acquisitions costs and other costs directly associated with such activities. |
||||||
|
5 |
Represents costs associated with non-cash purchase accounting adjustments, such as acquired inventory fair market value adjustments, which are amortized over the period in which underlying products are sold. |
||||||
Reconciliation of Non-GAAP Information
Management uses certain non-GAAP financial measures such as non-GAAP earnings per share, non-GAAP net income, non-GAAP operating expenses and non-GAAP operating profit margin, which exclude amortization of intangible assets, purchase accounting related charges, leasehold related charges, integration related expenses associated with acquired businesses, one-time restructuring and acquisition related items, CEO transition related costs, certain litigation charges, non-cash interest expense and/or losses on convertible notes, and the impact from taxes related to these items, including those taxes that would have occurred in lieu of these items. Management also uses certain non-GAAP measures which are intended to exclude the impact of foreign exchange currency fluctuations. The measure constant currency is the use of an exchange rate that eliminates fluctuations when calculating financial performance numbers.
The Company also uses measures such as free cash flow, which represents cash flow from operations less cash used in the acquisition and disposition of capital. Additionally, the Company uses an adjusted EBITDA measure which represents earnings before interest, taxes, depreciation and amortization and excludes the impact of stock-based compensation, purchase accounting related changes, leasehold related charges, integration related expenses associated with acquired businesses, CEO transition related costs, certain litigation liabilities, acquisition related items and other significant one-time items. Management calculates the non-GAAP financial measures provided in this earnings release excluding these costs and uses these non-GAAP financial measures to enable it to further and more consistently analyze the period-to-period financial performance of its core business operations. Management believes that providing investors with these non-GAAP measures gives them additional information to enable them to assess, in the same way management assesses, the Company’s current and future continuing operations. These non-GAAP measures are not in accordance with, or an alternative for, GAAP, and may be different from non-GAAP measures used by other companies. Set forth below are reconciliations of the non-GAAP financial measures to the comparable GAAP financial measure.
|
Reconciliation of Second Quarter 2017 Results |
||||||||
|
GAAP Net Income per Share to Non-GAAP Earnings per Share |
||||||||
|
(in thousands, except per share data) |
Adjustments |
Diluted Earnings Per |
||||||
|
GAAP net income |
$ 12,661 |
$ 0.22 |
||||||
|
Business transition costs 1 |
1,369 |
|||||||
|
Non-cash interest expense on convertible notes |
4,665 |
|||||||
|
Amortization of intangible assets 2 |
11,028 |
|||||||
|
Tax effect of adjustments 3 |
(5,661) |
|||||||
|
Adjustments to GAAP net income |
11,401 |
|||||||
|
Non-GAAP earnings |
$ 24,062 |
$ 0.46 |
||||||
|
GAAP weighted shares outstanding – diluted |
58,330 |
|||||||
|
Non-GAAP weighted shares outstanding – diluted 4 |
52,743 |
|||||||
|
1 |
Costs related to acquisition, integration and business transition activities which include severance, relocation, consulting, leasehold exit costs, third party merger and acquisitions costs and other costs directly associated with such activities. |
|||||||
|
2 |
Excludes the amortization associated with non-controlling interest. |
|||||||
|
3 |
The impact on results from taxes include tax effecting the adjustments above at the statutory rate as well as taking into account discrete items and including those discrete items in the annual effective tax rate calculation. The Company also includes those adjustments that would have benefited the tax rate in lieu of the above adjustments as part of the Company’s tax filings. The impact of the changes to the tax rate results in an annual estimated rate of ~35% on a non-GAAP basis. |
|||||||
|
4 |
Excludes the impact of dilutive convertible notes and warrants for which the Company is economically hedged through its anti-dilutive bond hedge arrangements. |
|||||||
|
Reconciliation of Year To Date 2017 Results |
||||||||
|
GAAP Net Income per Share to Non-GAAP Earnings per Share |
||||||||
|
(in thousands, except per share data) |
Adjustments |
Diluted Earnings Per |
||||||
|
GAAP net income |
$ 25,429 |
$ 0.44 |
||||||
|
Business transition costs 1 |
1,424 |
|||||||
|
Non-cash interest expense on convertible notes |
9,264 |
|||||||
|
Amortization of intangible assets 2 |
22,766 |
|||||||
|
Tax effect of adjustments 3 |
(14,784) |
|||||||
|
Adjustments to GAAP net income |
18,670 |
|||||||
|
Non-GAAP earnings |
$ 44,099 |
$ 0.84 |
||||||
|
GAAP weighted shares outstanding – diluted |
58,059 |
|||||||
|
Non-GAAP weighted shares outstanding – diluted 4 |
52,713 |
|||||||
|
1 |
Costs related to acquisition, integration and business transition activities which include severance, relocation, consulting, leasehold exit costs, third party merger and acquisitions costs and other costs directly associated with such activities. |
|||||||
|
2 |
Excludes the amortization associated with non-controlling interest. |
|||||||
|
3 |
The impact on results from taxes include tax effecting the adjustments above at the statutory rate as well as taking into account discrete items and including those discrete items in the annual effective tax rate calculation. The Company also includes those adjustments that would have benefited the tax rate in lieu of the above adjustments as part of the Company’s tax filings. The impact of the changes to the tax rate results in an annual estimated rate of ~35% on a non-GAAP basis. |
|||||||
|
4 |
Excludes the impact of dilutive convertible notes and warrants for which the Company is economically hedged through its anti-dilutive bond hedge arrangements. |
|||||||
|
Reconciliation of Second Quarter and Six Months 2017 Results |
|||||
|
GAAP net income to Adjusted EBITDA |
|||||
|
Three months ended |
Six months ended |
||||
|
(in thousands, except per share data) |
June 30, 2017 |
June 30, 2017 |
|||
|
GAAP net income |
$ 12,661 |
$ 25,429 |
|||
|
Interest expense/(income), net |
9,944 |
19,606 |
|||
|
Provision for income taxes |
7,079 |
8,569 |
|||
|
Depreciation and amortization 1 |
28,856 |
58,014 |
|||
|
EBITDA |
$ 58,540 |
$ 111,618 |
|||
|
Business transition costs2 |
1,369 |
1,424 |
|||
|
Non-cash stock based compensation |
8,394 |
15,411 |
|||
|
Adjusted EBITDA |
$ 68,303 |
$ 128,453 |
|||
|
As a percentage of revenue |
26.2% |
25.2% |
|||
|
1 |
Excludes the amortization associated with non-controlling interest. |
||||
|
2 |
Costs related to acquisition, integration and business transition activities which includes severance, relocation, consulting, leasehold exit costs, third party merger and acquisitions costs and other costs directly associated with such activities. |
||||
Investor Conference Call
NuVasive will hold a conference call today at 4:30 p.m. ET / 1:30 p.m. PT to discuss the results of its financial performance for the second quarter 2017. The dial-in numbers are 1-877-407-9039 for domestic callers and 1-201-689-8470 for international callers. A live webcast of the conference call will be available online from the Investor Relations page of the Company’s website at www.nuvasive.com. After the live webcast, the call will remain available on NuVasive’s website through August 28, 2017. In addition, a telephone replay of the call will be available until August 3, 2017. The replay dial-in numbers are 1-844-512-2921 for domestic callers and 1-412-317-6617 for international callers. Please use pin number: 13665648.
About NuVasive
NuVasive, Inc. (NASDAQ: NUVA) is transforming spine surgery and beyond with minimally invasive, procedurally-integrated solutions designed to deliver reproducible and clinically-proven surgical outcomes. The Company’s portfolio includes access instruments, implantable hardware, biologics, software systems for surgical planning, navigation and imaging solutions, magnetically adjustable implant systems for spine and orthopedics, and intraoperative monitoring service offerings. With $962 million in revenues (2016), NuVasive has an approximate 2,300 person workforce in more than 40 countries serving surgeons, hospitals and patients. For more information, please visit www.nuvasive.com.
Forward-Looking Statements
NuVasive cautions you that statements included in this news release or made on the investor conference call referenced herein that are not a description of historical facts are forward-looking statements that involve risks, uncertainties, assumptions and other factors which, if they do not materialize or prove correct, could cause NuVasive’s results to differ materially from historical results or those expressed or implied by such forward-looking statements. In addition, this news release contains selected financial results from the second quarter 2017, as well as projections for 2017 financial guidance and longer-term financial performance goals. The numbers for the second quarter 2017 are prior to the completion of review procedures by the Company’s external auditors and are subject to adjustment. In addition, the Company’s projections for 2017 financial guidance and longer-term financial performance goals represent current estimates, including initial estimates of the potential benefits, synergies and cost savings associated with acquisitions, which are subject to the risk of being inaccurate because of the preliminary nature of the forecasts, the risk of further adjustment, or unanticipated difficulty in selling products or generating expected profitability. The potential risks and uncertainties that could cause actual growth and results to differ materially include, but are not limited to: the risk that NuVasive’s revenue or earnings projections may turn out to be inaccurate because of the preliminary nature of the forecasts; the risk of further adjustment to financial results or future financial expectations; unanticipated difficulty in selling products, generating revenue or producing expected profitability; the risk that acquisitions will not be integrated successfully or that the benefits and synergies from the acquisition may not be fully realized or may take longer to realize than expected; and those other risks and uncertainties more fully described in the Company’s news releases and periodic filings with the Securities and Exchange Commission. NuVasive’s public filings with the Securities and Exchange Commission are available at www.sec.gov. The forward-looking statements contained herein are based on the current expectations and assumptions of NuVasive and not on historical facts. NuVasive assumes no obligation to update any forward-looking statement to reflect events or circumstances arising after the date on which it was made.
|
NuVasive, Inc. |
||||||||
|
Consolidated Statements of Operations |
||||||||
|
(in thousands, except per share data) |
||||||||
|
Three Months Ended June 30, |
Six Months Ended June 30, |
|||||||
|
(unaudited) |
2017 |
2016 |
2017 |
2016 |
||||
|
Revenue |
$ 260,573 |
$ 236,210 |
$ 510,437 |
$ 451,314 |
||||
|
Cost of goods sold (excluding below amortization of intangible assets) |
66,421 |
59,745 |
128,034 |
113,971 |
||||
|
Gross profit |
194,152 |
176,465 |
382,403 |
337,343 |
||||
|
Operating expenses: |
||||||||
|
Sales, marketing and administrative |
139,109 |
134,487 |
279,611 |
259,325 |
||||
|
Research and development |
12,572 |
11,871 |
24,986 |
22,500 |
||||
|
Amortization of intangible assets |
11,349 |
10,603 |
23,410 |
18,474 |
||||
|
Litigation liability (gain) |
— |
(43,310) |
— |
(43,310) |
||||
|
Business transition costs |
1,369 |
2,756 |
1,424 |
8,063 |
||||
|
Total operating expenses |
164,399 |
116,407 |
329,431 |
265,052 |
||||
|
Interest and other expense, net: |
||||||||
|
Interest income |
139 |
406 |
276 |
734 |
||||
|
Interest expense |
(10,083) |
(10,537) |
(19,882) |
(19,009) |
||||
|
Loss on repurchases of convertible notes |
— |
— |
— |
(17,444) |
||||
|
Other expense, net |
(501) |
(246) |
(243) |
(196) |
||||
|
Total interest and other expense, net |
(10,445) |
(10,377) |
(19,849) |
(35,915) |
||||
|
Income before income taxes |
19,308 |
49,681 |
33,123 |
36,376 |
||||
|
Income tax expense |
(7,079) |
(19,891) |
(8,569) |
(10,411) |
||||
|
Consolidated net income |
$ 12,229 |
$ 29,790 |
$ 24,554 |
$ 25,965 |
||||
|
Add back net loss attributable to non-controlling interest |
$ (432) |
$ (423) |
$ (875) |
$ (880) |
||||
|
Net income attributable to NuVasive, Inc. |
$ 12,661 |
$ 30,213 |
$ 25,429 |
$ 26,845 |
||||
|
Net income per share attributable to NuVasive, Inc.: |
||||||||
|
Basic |
$ 0.25 |
$ 0.60 |
$ 0.50 |
$ 0.54 |
||||
|
Diluted |
$ 0.22 |
$ 0.57 |
$ 0.44 |
$ 0.51 |
||||
|
Weighted average shares outstanding: |
||||||||
|
Basic |
51,082 |
50,027 |
50,825 |
49,822 |
||||
|
Diluted |
58,330 |
53,159 |
58,059 |
52,354 |
||||
|
NuVasive, Inc. |
||||
|
Consolidated Balance Sheets |
||||
|
(in thousands, except par values and share amounts) |
||||
|
June 30, 2017 |
December 31, 2016 |
|||
|
ASSETS |
(Unaudited) |
|||
|
Current assets: |
||||
|
Cash and cash equivalents |
$ 130,932 |
$ 153,643 |
||
|
Restricted cash and investments |
2,402 |
— |
||
|
Accounts receivable, net of allowances of $9,399 and $8,912, respectively |
190,169 |
171,595 |
||
|
Inventory, net |
236,839 |
208,249 |
||
|
Prepaid income taxes |
19,576 |
31,926 |
||
|
Prepaid expenses and other current assets |
12,310 |
10,030 |
||
|
Total current assets |
592,228 |
575,443 |
||
|
Property and equipment, net |
214,601 |
181,524 |
||
|
Intangible assets, net |
268,466 |
291,143 |
||
|
Goodwill |
486,439 |
485,685 |
||
|
Deferred tax assets |
5,961 |
5,810 |
||
|
Restricted cash and investments |
4,945 |
7,405 |
||
|
Other assets |
33,744 |
23,794 |
||
|
Total assets |
$ 1,606,384 |
$ 1,570,804 |
||
|
LIABILITIES AND EQUITY |
||||
|
Current liabilities: |
||||
|
Accounts payable and accrued liabilities |
$ 82,933 |
$ 77,585 |
||
|
Contingent consideration liabilities |
19,271 |
49,742 |
||
|
Accrued payroll and related expenses |
49,323 |
51,000 |
||
|
Income tax liabilities |
11,995 |
2,469 |
||
|
Short-term borrowings |
20,000 |
— |
||
|
Senior convertible notes |
63,302 |
61,701 |
||
|
Total current liabilities |
246,824 |
242,497 |
||
|
Long-term senior convertible notes |
573,532 |
564,412 |
||
|
Deferred and income tax liabilities, non-current |
16,110 |
18,607 |
||
|
Other long-term liabilities |
46,312 |
44,764 |
||
|
Commitments and contingencies |
||||
|
Stockholders’ equity: |
||||
|
Preferred stock, $0.001 par value; 5,000,000 shares authorized, none outstanding |
— |
— |
||
|
Common stock, $0.001 par value; 120,000,000 shares authorized at June 30, 2017 and December 31, 2016, 58,081,702 and 55,184,660 issued and outstanding at June 30, 2017 and December 31, 2016, respectively |
58 |
55 |
||
|
Additional paid-in capital |
1,033,546 |
1,010,238 |
||
|
Accumulated other comprehensive loss |
(8,131) |
(10,631) |
||
|
Accumulated deficit |
(53,077) |
(66,859) |
||
|
Treasury stock at cost; 4,974,534 shares and 4,758,828 shares at June 30, 2017 and December 31, 2016, respectively |
(253,503) |
(237,867) |
||
|
Total NuVasive, Inc. stockholders’ equity |
718,893 |
694,936 |
||
|
Non-controlling interest |
4,713 |
5,588 |
||
|
Total equity |
723,606 |
700,524 |
||
|
Total liabilities and equity |
$ 1,606,384 |
$ 1,570,804 |
||
|
NuVasive, Inc. |
||||
|
Consolidated Statements of Cash Flows |
||||
|
(in thousands) |
||||
|
Six Months Ended June 30, |
||||
|
(unaudited) |
2017 |
2016 |
||
|
Operating activities: |
||||
|
Consolidated net income |
$ 24,554 |
$ 25,965 |
||
|
Adjustments to reconcile net income to net cash provided by operating activities: |
||||
|
Depreciation and amortization |
58,688 |
46,329 |
||
|
Loss on repurchases of convertible notes |
— |
17,444 |
||
|
Amortization of non-cash interest |
10,882 |
10,943 |
||
|
Stock-based compensation |
15,411 |
12,357 |
||
|
Reserves on current assets |
(95) |
6,751 |
||
|
Other non-cash adjustments |
7,380 |
8,387 |
||
|
Deferred income taxes |
(2,570) |
14,691 |
||
|
Changes in operating assets and liabilities, net of effects from acquisitions: |
||||
|
Accounts receivable |
(17,586) |
(8,615) |
||
|
Inventory |
(29,012) |
(12,019) |
||
|
Prepaid expenses and other current assets |
(2,485) |
728 |
||
|
Contingent consideration liabilities |
(11,200) |
— |
||
|
Accounts payable and accrued liabilities |
4,987 |
14,384 |
||
|
Litigation liability |
— |
(43,310) |
||
|
Accrued payroll and related expenses |
(2,004) |
(4,356) |
||
|
Income taxes |
10,172 |
10,534 |
||
|
Net cash provided by operating activities |
67,122 |
100,213 |
||
|
Investing activities: |
||||
|
Acquisition of Ellipse Technologies, net of cash acquired |
— |
(380,080) |
||
|
Other acquisitions and investments |
(14,417) |
(8,079) |
||
|
Purchases of intangible assets |
(1,695) |
(5,918) |
||
|
Purchases of property and equipment |
(68,690) |
(52,566) |
||
|
Purchases of marketable securities |
— |
(128,956) |
||
|
Proceeds from sales of marketable securities |
— |
339,320 |
||
|
Net cash used in investing activities |
(84,802) |
(236,279) |
||
|
Financing activities: |
||||
|
Proceeds from the issuance of common stock |
5,369 |
6,150 |
||
|
Purchase of treasury stock |
(10,844) |
(22,549) |
||
|
Payment of contingent consideration |
(18,800) |
— |
||
|
Proceeds from issuance of convertible debt, net of issuance costs |
— |
634,140 |
||
|
Proceeds from sale of warrants |
— |
44,850 |
||
|
Purchase of convertible note hedge |
— |
(111,150) |
||
|
Repurchases of convertible notes |
— |
(343,835) |
||
|
Proceeds from revolving line of credit |
20,000 |
50,000 |
||
|
Repayments on revolving line of credit |
— |
(50,000) |
||
|
Other financing activities |
(2,205) |
(1,545) |
||
|
Net cash (used in)provided by financing activities |
(6,480) |
206,061 |
||
|
Effect of exchange rate changes on cash |
1,449 |
748 |
||
|
(Decrease) increase in cash and cash equivalents |
(22,711) |
70,743 |
||
|
Cash and cash equivalents at beginning of period |
153,643 |
192,339 |
||
|
Cash and cash equivalents at end of period |
$ 130,932 |
$ 263,082 |
||
SOURCE NuVasive, Inc.

SAN DIEGO, July 27, 2017 /PRNewswire/ — NuVasive, Inc. (NASDAQ: NUVA), a leading medical device company focused on transforming spine surgery with minimally disruptive, procedurally-integrated solutions, today announced a new organizational structure to drive the Company’s growth and profitability goals, supporting its strategy to help deliver safer, more predictable spine surgery.
“As the innovation pioneer and largest, pure-play spine technology company, NuVasive continues to deliver significant value to its customers and shareholders,” said Gregory T. Lucier, NuVasive’s chairman and chief executive officer. “With incredible opportunities ahead, we are taking steps to refine the company’s operating structure to tightly align strategy, product development and marketing and integrate our global commercial channels, while scaling global operations to best address the growing needs of our partners and patients.”
Today the Company announced that Jason Hannon, president and chief operating officer, is stepping down from his position to pursue other interests. He will remain with NuVasive through the end of the year in an advisory capacity. During Mr. Hannon’s successful 12-year career at NuVasive, he has made countless important contributions to the Company. In connection with Mr. Hannon’s departure, the Company has accelerated its timeline to implement organizational changes that will position NuVasive to execute against the Company’s strategic goals. Effective August 1, the Company will:
Matt Link, president, U.S. Commercial is being promoted to a key leadership role as executive vice president, Strategy, Technology and Corporate Development, a newly created position to further drive the Company’s innovation agenda. Mr. Link is a long-tenured NuVasive executive with more than 15 years of industry experience, including extensive knowledge of the U.S. spine marketplace, as well as surgeon and hospital dynamics. In this role, he will lead product and systems development, global marketing, surgeon education, clinical research and corporate development. Mr. Link’s experience in surgeon requirements and commercial operations will be key as NuVasive continues to bring leading innovation to market.
Skip Kiil, executive vice president, International is named executive vice president, Global Commercial. Mr. Kiil joined NuVasive in June and has more than 15 years of experience as a global medical technologies and life sciences business leader. He was previously with Alcon, a division of Novartis Corporation, where he most recently served as surgical head, Europe, Middle East, Africa and Russia. He is a proven leader in managing and growing complex, global commercial enterprises internationally and domestically within the healthcare and spine technology industries. His strategic and operational expertise in market entry and development are critical as NuVasive seeks to double its International market share in the coming years and further expand the Company’s position in the U.S. marketplace.
Steve Rozow, vice president, Global Operations, assumes an elevated role as executive vice president, Global Process Transformation, including IT and RA/QA, in addition to his current Global Operations responsibilities. Since joining NuVasive in 2015, Mr. Rozow has led improvements in supply chain and fulfillment, as well as the successful development of the Company’s new manufacturing facility in West Carrollton, Ohio. Mr. Rozow is an experienced medical device leader including more than 20 years with Zimmer, where he served in various manufacturing and operational leadership roles. His position is critical as the Company focuses on scaling global operations and driving operational improvement initiatives.
Unrelated to the organizational updates announced today, the Company has accepted the resignation of its chief financial officer, Quentin Blackford, effective August 25, 2017. Mr. Blackford is pursuing another opportunity outside the spine industry and has agreed to remain with the company during this transition period. Mr. Blackford’s resignation is not the result of any dispute or disagreement with NuVasive, including any matters relating to the Company’s accounting practices or financial reporting. Vickie Capps, in her role as an independent member of NuVasive’s board of directors and a member of the audit committee, will provide guidance and support to the Company’s financial organization during the transition period. Ms. Capps is a well-respected financial executive, having served as CFO of DJO Global, as well as CFO of several public and private companies. Ms. Capps will also assist the Company in its search for a successor to Mr. Blackford.
“Since becoming CEO over two years ago, I have been working with our board to build a world-class leadership team to support our revenue growth and profitability goals. Together, we are executing against our 5-year strategic plan and building a deep bench of talent, positioning us well to execute against our short- and long-term initiatives. I remain more confident than ever in our Company’s position to take on the next $1 billion in growth,” said Lucier.
About NuVasive
NuVasive, Inc. (NASDAQ: NUVA) is transforming spine surgery and beyond with minimally invasive, procedurally-integrated solutions designed to deliver reproducible and clinically-proven surgical outcomes. The Company’s portfolio includes access instruments, implantable hardware, biologics, software systems for surgical planning, navigation and imaging solutions, magnetically adjustable implant systems for spine and orthopedics, and intraoperative monitoring service offerings. With $962 million in revenues (2016), NuVasive has an approximate 2,300 person workforce in more than 40 countries serving surgeons, hospitals and patients. For more information, please visit www.nuvasive.com.
Forward-Looking Statements
NuVasive cautions you that statements included in this news release that are not a description of historical facts are forward-looking statements that involve risks, uncertainties, assumptions and other factors which, if they do not materialize or prove correct, could cause NuVasive’s results to differ materially from historical results or those expressed or implied by such forward-looking statements. The potential risks and uncertainties which contribute to the uncertain nature of these statements include, among others, risks associated with acceptance of the Company’s surgical products and procedures by spine surgeons, development and acceptance of new products or product enhancements, clinical and statistical verification of the benefits achieved via the use of NuVasive’s products (including the iGA® platform), the Company’s ability to effectually manage inventory as it continues to release new products, its ability to recruit and retain management and key personnel, and the other risks and uncertainties described in NuVasive’s news releases and periodic filings with the Securities and Exchange Commission. NuVasive’s public filings with the Securities and Exchange Commission are available at www.sec.gov. NuVasive assumes no obligation to update any forward-looking statement to reflect events or circumstances arising after the date on which it was made.
SOURCE NuVasive, Inc.
LONDON, July 26, 2017 /PRNewswire/ — KEY FINDINGS
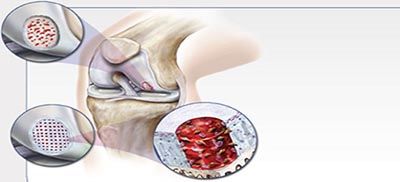
The orthobiologics global market is anticipated to grow from $ 6596 million in 2016 to $ 12019 million by 2025. The market is expected to grow at a CACR of 6.97% between 2017-2027. The base year considered for the market study is 2016. The forecast period is 2017-2025. Evolvement in orthobiologics has led to the development of tissue regeneration products and bone grafts that minimize hospital visits, stays and bone healing process.
MARKET INSIGHTS
The global orthobiologics market is segmented on the basis of product type, application, end-user, and geography. The global orthobiologics market by product type is segmented into the demineralized bone matrix (DBM), allograft, bone morphogenetic protein, viscosupplementation, synthetic bone graft substitutes, stem cell therapy and others.
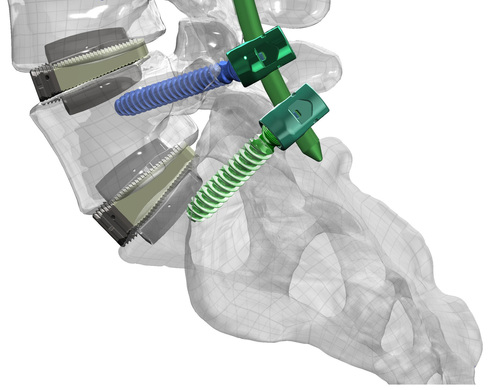
The application segment is further bifurcated into spinal fusion, trauma repair, and reconstructive surgery and others. The end-user is segmented into hospitals and clinics. The orthobiologics market by geography is classified into North America, Europe, Asia-Pacific and rest of the world. The rise in the demand for spinal fusion surgeries, development in Strategic Partnerships, and growth in Orthobiologics Material are the major drivers for the global Orthopedics market. Healthcare reforms (such as Stark self-referral law and fraud & abuse law) are estimated to have affected the Orthobiologics surgeons. Bone Regeneration Technology, Larger Spend on Healthcare is the major opportunities in the Orthobiologics Market.
REGIONAL INSIGHTS
The Orthobiologics market in North America is expected to hold the colossal share by 2024. The increase in research and a rising demand for the products, increasing research investments, aging population growth and an increased number of road accidents are major drivers of the region. Asia-Pacific is estimated with the highest CAGR of 7.09% due to the increased demand for biological implants over mechanical implants, coupled with the growing awareness levels about the benefits of Orthobiologics. Europe has generated revenue of $1705 million in 2016 and is expected to generate revenue of $3077 million by 2024. The rise in the aging population, increased incidences of osteoarthritis and osteoporosis, technological advancements in the European countries are driving the market to grow at a faster pace.
COMPETITIVE INSIGHTS
Major players for the Orthobiologics market are Bioventus, DePuy Inc. (Acquired by Johnson and Johnson), Exatech Inc., Globus Medical Inc., Integra Life sciences Holding Corporation, Johnson& Johnson, Medtronic Inc., Nuvasive Inc., RTI Surgical, Sanofi, Stryker Corporation, Zimmer Biomet Inc., and Mölnlycke Health Care AB. DePuy Inc.
Download the full report: https://www.reportbuyer.com/product/4825329/
About Reportbuyer
Reportbuyer is a leading industry intelligence solution that provides all market research reports from top publishers
http://www.reportbuyer.com
For more information:
Sarah Smith
Research Advisor at Reportbuyer.com
Email: query@reportbuyer.com
Tel: +44 208 816 85 48
Website: www.reportbuyer.com
WAYNE, Pa., July 27, 2017 /PRNewswire/ — Camber Spine Technologies, today announced that they have exceeded 150 implantations of the ENZA™ Zero-Profile ALIF device that was launched last July.
“We have been doing anterior spine reconstructions for over 20 years and have used a lot of different ALIF devices,” said Orthopedic Surgeon, Dr. Steven B. Wolf, M.D. of OIP in Camp Hill, PA. “I have extensive experience using the Globus Independence®, Zimmer-LDR ROI-A® and other ALIF devices from Renovis and Titan Spine. The ENZA™ has been an indispensable alternative to all those implants. I can insert ENZA™ and deploy fixation with one instrument and I have the reassurance that I can easily remove it if needed. With the insertion of ENZA™ the patient’s spine feels immediate stabilization, especially if they need to be flipped for posterior instrumentation. Our access surgeon loves this implant, because it makes his job much easier. ENZA’s™ single instrument deployment, without extra retraction of the vessels, eliminates the need for passing multiple locking instrumentation required by other devices.”
ENZA™ was designed to increase patient safety by minimizing retraction necessary for implantation of the device, utilizing its integrated fixation. It is often described as “designed for the access surgeon” because of its completely inline instrumentation–which relieves the burden that other systems induce by requiring larger retraction to accommodate angled instrumentation.
“We are very excited to achieve this important milestone in the initial launch of the ENZA™ ALIF,” said Daniel Pontecorvo, Camber Spine’s CEO. The overwhelming interest and success of ENZA™ reaffirms our plan to make this the first of an entire platform of products utilizing our patented ENZA™ Duo Presa™ (Two Grips) Anchor Technology. Surgeons assert that it is a simpler, safer and more stable alternative to all other locking ALIF devices.”
This achievement comes at an inflexion point for Camber Spine, as they continue to expand sales into new territories of the U.S with new hires.
The Camber Spine Technologies ENZA™ MIS Zero-Profile Anterior Interbody Fusion is indicated for use with autogenous bone graft in patients with degenerative disc disease (DDD) at one or two contiguous levels from L2 to S1. These implants may be implanted via a laparoscopic or an open anterior approach. The Camber Spine Technologies’ ENZA™ MIS Zero-Profile ALIF is intended to be used with additional FDA-cleared supplementary fixation systems.
About Camber Spine
Camber Spine Technologies, LLP, is a fast-growing musculoskeletal implant company founded in 2010 bringing innovative, best-in-class products to the market, providing surgeons and their patients with better treatment options. The company is committed to delivering surgeon inspired new technologies to the spine market. Camber is an ISO 13485 certified medical device company. Camber Spine Technologies, located in Wayne, Pennsylvania, markets a line of proprietary musculoskeletal products nationwide through its exclusive distributor, S1 Spine. For further information please visit www.cambermedtech.com . For inquiries about ENZA® or distribution opportunities please call 484.427.7060.
All of Camber Spine Technologies’ products are proudly MADE IN THE USA.
SOURCE Camber Spine Technologies

WARSAW, Ind., July 27, 2017 /PRNewswire/ — Zimmer Biomet Holdings, Inc. (NYSE and SIX: ZBH) today reported financial results for the quarter ended June 30, 2017. The Company reported second quarter net sales of $1.954 billion, an increase of 1.1% over the prior year period, and an increase of 2.1% on a constant currency basis. Excluding approximately 240 basis points of contribution from the LDR Holding Corporation acquisition, second quarter 2017 revenues decreased 1.3% from the second quarter of 2016, or 0.3% on a constant currency basis.
Diluted earnings per share for the quarter were $0.90. Adjusted diluted earnings per share for the quarter were $2.08, an increase of 3.0% over the prior year period.
“During the second quarter, we increased production output from our Warsaw North Campus manufacturing facility, and continued to drive efforts to achieve best-in-class quality systems. Our sales growth fell short of our expectations, due in part to production delays of certain key brands and slower-than-expected sales recapture from previously affected customers in the United States. These factors have informed our updated outlook for the full year,” said Daniel P. Florin, Interim Chief Executive Officer, Senior Vice President and Chief Financial Officer of Zimmer Biomet. “Looking forward, we remain focused on fully restoring product supply to enhance our commercial execution, while continuing to closely engage with our customers and take advantage of the opportunities in front of us.”
“We have great confidence in Dan as he transitions into the role of Interim CEO. He has already begun to leverage his deep knowledge of Zimmer Biomet and decades of medical device industry experience to lead the Company during this period,” said Larry C. Glasscock, Chairman of the Board of Zimmer Biomet. “We have initiated a thorough search to identify the best candidate to serve as Zimmer Biomet’s next CEO. We are seeking a strong leader, whose strategic and operational track record aligns with Zimmer Biomet’s commitment to growth and enhancing stockholder value.”
Net earnings for the second quarter were $184.2 million, and $424.6 million on an adjusted basis, an increase of 4.3% over the prior year period. Operating cash flow for the second quarter was $440.5 million.
In the quarter, the Company paid $48.4 million in dividends and declared a second quarter dividend of $0.24 per share. The Company has made approximately $650 million of net debt repayments through the first half of 2017.
Guidance
The Company is updating its full-year 2017 constant currency revenue and adjusted earnings per share guidance. For the full year, the Company now expects revenue in the range of $7.80 billion to $7.87 billion, representing constant currency revenue growth of 1.8% to 2.7% compared to the prior year, inclusive of approximately 120 basis points of contribution from the LDR transaction. Previously, the Company had expected full-year, constant currency revenue growth between 3.2% and 4.2%, inclusive of approximately 120 basis points of contribution from the LDR transaction. Additionally, the Company now expects its full-year 2017 diluted earnings per share to be in a range of $4.15 to $4.35, and in a range of $8.20 to $8.30 on an adjusted basis. Previously, the Company had expected full-year 2017 diluted earnings per share to be in a range of $4.68 to $4.88, and in a range of $8.50 to $8.60 on an adjusted basis.
For the third quarter of 2017, the Company expects revenue in the range of $1.815 billion to $1.845 billion, representing constant currency revenue growth of negative 0.5% to positive 1.0% compared to the prior year period, inclusive of approximately 30 basis points of contribution from the LDR transaction. Additionally, the Company expects its diluted earnings per share for the third quarter to be in a range of $0.60 to $0.70, and in a range of $1.72 to $1.77 on an adjusted basis.
Conference Call
The Company will conduct its second quarter 2017 investor conference call today, July 27, 2017, at 8:00 a.m. Eastern Time. The live audio webcast can be accessed via Zimmer Biomet’s Investor Relations website at http://investor.zimmerbiomet.com. It will be archived for replay following the conference call.
Individuals in the U.S. and Canada who wish to dial into the conference call may do so by dialing (888) 312-9837 and entering conference ID 7278985. For a complete listing of international toll-free and local numbers, please visit http://investor.zimmerbiomet.com. A digital recording will be available 24 hours after the completion of the conference call, from July 28, 2017 to August 26, 2017. To access the recording, U.S. callers should dial (888) 203-1112 and international callers should dial +1 (719) 457-0820, and enter the Access Code ID 7278985.
Sales Tables
The following sales tables provide results by geography and product category, as well as the percentage change compared to the prior year quarter and six months, on both a reported and a constant currency basis.
|
NET SALES – THREE MONTHS ENDED JUNE 30, 2017 |
|||||||||||
|
(in millions, unaudited) |
|||||||||||
|
Constant |
|||||||||||
|
Net |
Currency |
||||||||||
|
Sales |
% Change |
% Change |
|||||||||
|
Geographic Results |
|||||||||||
|
Americas |
$ |
1,209 |
2.3 |
% |
2.5 |
% |
|||||
|
EMEA |
438 |
(4.9) |
(1.8) |
||||||||
|
Asia Pacific |
307 |
5.3 |
6.8 |
||||||||
|
Total |
$ |
1,954 |
1.1 |
% |
2.1 |
% |
|||||
|
Product Categories |
|||||||||||
|
Knees |
|||||||||||
|
Americas |
$ |
406 |
(2.7) |
% |
(2.6) |
% |
|||||
|
EMEA |
159 |
(5.3) |
(1.7) |
||||||||
|
Asia Pacific |
115 |
3.4 |
4.2 |
||||||||
|
Total |
680 |
(2.4) |
(1.3) |
||||||||
|
Hips |
|||||||||||
|
Americas |
245 |
(1.4) |
(1.2) |
||||||||
|
EMEA |
131 |
(5.7) |
(3.0) |
||||||||
|
Asia Pacific |
94 |
4.4 |
6.6 |
||||||||
|
Total |
470 |
(1.5) |
(0.2) |
||||||||
|
S.E.T (1) |
423 |
2.6 |
3.6 |
||||||||
|
Dental |
110 |
(6.4) |
(5.7) |
||||||||
|
Spine & CMF |
194 |
33.0 |
33.5 |
||||||||
|
Other |
77 |
(8.0) |
(7.0) |
||||||||
|
Total |
$ |
1,954 |
1.1 |
% |
2.1 |
% |
|||||
|
(1) Surgical, Sports Medicine, Foot and Ankle, Extremities and Trauma |
|||||||||||
|
NET SALES – SIX MONTHS ENDED JUNE 30, 2017 |
||||||||||
|
(in millions, unaudited) |
||||||||||
|
Constant |
||||||||||
|
Net |
Currency |
|||||||||
|
Sales |
% Change |
% Change |
||||||||
|
Geographic Results |
||||||||||
|
Americas |
$ |
2,444 |
3.6 |
% |
3.6 |
% |
||||
|
EMEA |
891 |
(2.8) |
0.6 |
|||||||
|
Asia Pacific |
597 |
6.1 |
6.4 |
|||||||
|
Total |
$ |
3,932 |
2.4 |
% |
3.3 |
% |
||||
|
Product Categories |
||||||||||
|
Knees |
||||||||||
|
Americas |
$ |
835 |
(1.4) |
% |
(1.4) |
% |
||||
|
EMEA |
328 |
(4.4) |
(0.4) |
|||||||
|
Asia Pacific |
219 |
4.1 |
3.7 |
|||||||
|
Total |
1,382 |
(1.3) |
(0.4) |
|||||||
|
Hips |
||||||||||
|
Americas |
492 |
(0.6) |
(0.6) |
|||||||
|
EMEA |
267 |
(3.1) |
(0.2) |
|||||||
|
Asia Pacific |
187 |
6.9 |
7.8 |
|||||||
|
Total |
946 |
– |
1.1 |
|||||||
|
S.E.T (1) |
848 |
4.3 |
5.0 |
|||||||
|
Dental |
218 |
(3.7) |
(2.9) |
|||||||
|
Spine & CMF |
380 |
32.5 |
32.8 |
|||||||
|
Other |
158 |
(4.9) |
(4.1) |
|||||||
|
Total |
$ |
3,932 |
2.4 |
% |
3.3 |
% |
||||
|
(1) Surgical, Sports Medicine, Foot and Ankle, Extremities and Trauma |
||||||||||
About the Company
Founded in 1927 and headquartered in Warsaw, Indiana, Zimmer Biomet is a global leader in musculoskeletal healthcare. We design, manufacture and market orthopaedic reconstructive products; sports medicine, biologics, extremities and trauma products; office based technologies; spine, craniomaxillofacial and thoracic products; dental implants; and related surgical products.
We collaborate with healthcare professionals around the globe to advance the pace of innovation. Our products and solutions help treat patients suffering from disorders of, or injuries to, bones, joints or supporting soft tissues. Together with healthcare professionals, we help millions of people live better lives.
We have operations in more than 25 countries around the world and sell products in more than 100 countries. For more information, visit www.zimmerbiomet.com or follow Zimmer Biomet on Twitter at www.twitter.com/zimmerbiomet.
Website Information
We routinely post important information for investors on our website, www.zimmerbiomet.com, in the “Investor Relations” section. We use this website as a means of disclosing material, non-public information and for complying with our disclosure obligations under Regulation FD. Accordingly, investors should monitor the Investor Relations section of our website, in addition to following our press releases, SEC filings, public conference calls, presentations and webcasts. The information contained on, or that may be accessed through, our website is not incorporated by reference into, and is not a part of, this document.
Note on Non-GAAP Financial Measures
This press release includes non-GAAP financial measures that differ from financial measures calculated in accordance with U.S. generally accepted accounting principles (“GAAP”). These non-GAAP financial measures may not be comparable to similar measures reported by other companies and should be considered in addition to, and not as a substitute for, or superior to, other measures prepared in accordance with GAAP.
Sales change information for the three- and six-month periods ended June 30, 2017 is presented on a GAAP (reported) basis and on a constant currency basis, as well as on a basis that excludes the contribution from the Company’s acquisition of LDR Holding Corporation in July 2016. Constant currency rates exclude the effects of foreign currency exchange rates. They are calculated by translating current and prior-period sales at the same predetermined exchange rate. The translated results are then used to determine year-over-year percentage increases or decreases. Reconciliations of these non-GAAP financial measures to the most directly comparable GAAP measures are included in this press release.
Net earnings, diluted earnings per share and projected diluted earnings per share are presented on a GAAP (reported) basis and on an adjusted basis. Adjusted diluted earnings per share excludes the effects of inventory step-up; certain inventory and manufacturing-related charges connected to discontinuing certain product lines, quality enhancement and remediation efforts; special items; intangible asset amortization; any related effects on our income tax provision associated with these items; and other certain tax adjustments. Special items include expenses resulting directly from our business combinations and/or global restructuring, quality and operational excellence initiatives, including employee termination benefits, certain contract terminations, consulting and professional fees, dedicated project personnel, asset impairment or loss on disposal charges and other items. Other certain tax adjustments include a tax restructuring that lowered the tax rate on deferred tax liabilities recorded on intangible assets recognized in acquisition-related accounting, net favorable resolutions of various tax matters, and charges from internal restructuring transactions that provide the Company access to cash in a tax efficient manner.
Management uses these non-GAAP financial measures internally to evaluate the performance of the business and believes they are useful measures that provide meaningful supplemental information to investors to consider when evaluating the performance of the Company. Management believes these measures offer the ability to make period-to-period comparisons that are not impacted by certain items that can cause dramatic changes in reported operating results, to perform trend analysis, to better identify operating trends that may otherwise be masked or distorted by these types of items and to provide additional transparency of certain items. In addition, certain of these non-GAAP financial measures are used as performance metrics in the Company’s incentive compensation programs.
Cautionary Statement Regarding Forward-Looking Statements
This release contains forward-looking statements within the meaning of the safe harbor provisions of the Private Securities Litigation Reform Act of 1995, including, among others, statements regarding sales and earnings guidance and any statements about our expectations, plans, strategies or prospects. We generally use the words “may,” “will,” “expects,” “believes,” “anticipates,” “plans,” “estimates,” “projects,” “assumes,” “guides,” “targets,” “forecasts,” “sees,” “seeks,” “should,” “could,” “intends” and similar expressions to identify forward-looking statements. Such statements are based upon the current beliefs and expectations of management and are subject to significant risks, uncertainties and changes in circumstances that could cause actual outcomes and results to differ materially. These risks, uncertainties and changes in circumstances include, but are not limited to: our chief executive officer transition, including disruptions and uncertainties related thereto, our ability to appoint a permanent successor with the desired level of experience and expertise in a timely manner, the potential impact on our business and future strategic direction resulting from our transition to a new chief executive officer, and our ability to retain other key members of senior management; the possibility that the anticipated synergies and other benefits from mergers and acquisitions will not be realized, or will not be realized within the expected time periods; the risks and uncertainties related to our ability to successfully integrate the operations, products, employees and distributors of acquired companies; the effect of the potential disruption of management’s attention from ongoing business operations due to integration matters related to mergers and acquisitions; the effect of mergers and acquisitions on our relationships with customers, vendors and lenders and on our operating results and businesses generally; compliance with the Deferred Prosecution Agreement entered into in January 2017; the success of our quality and operational excellence initiatives; challenges relating to changes in and compliance with governmental laws and regulations, including regulations of the U.S. Food and Drug Administration (FDA) and foreign government regulators, such as more stringent requirements for regulatory clearance of products; the ability to remediate matters identified in any inspectional observations or warning letters issued by the FDA, while continuing to satisfy the demand for our products; the outcome of government investigations; price and product competition; changes in customer demand for our products and services caused by demographic changes or other factors; the impact of healthcare reform measures; reductions in reimbursement levels by third-party payors and cost containment efforts of healthcare purchasing organizations; dependence on new product development, technological advances and innovation; shifts in the product category or regional sales mix of our products and services; supply and prices of raw materials and products; control of costs and expenses; the ability to obtain and maintain adequate intellectual property protection; the ability to form and implement alliances; changes in tax obligations arising from tax reform measures or examinations by tax authorities; product liability and intellectual property litigation losses; the ability to retain the independent agents and distributors who market our products; dependence on a limited number of suppliers for key raw materials and outsourced activities; changes in general industry and market conditions, including domestic and international growth rates and general domestic and international economic conditions, including interest rate and currency exchange rate fluctuations; and the impact of the ongoing economic uncertainty affecting countries in the Euro zone on the ability to collect accounts receivable in affected countries. For a further list and description of such risks and uncertainties, see our reports filed with the U.S. Securities and Exchange Commission (SEC), including our Annual Report on Form 10-K for the year ended December 31, 2016 and our Quarterly Report on Form 10-Q for the quarter ended March 31, 2017. Copies of these filings, as well as subsequent filings, are available online at www.sec.gov, www.zimmerbiomet.com or on request from us. Forward-looking statements speak only as of the date they are made, and we disclaim any intention or obligation to update or revise any forward-looking statements, whether as a result of new information, future events or otherwise. Readers of this release are cautioned not to rely on these forward-looking statements, since there can be no assurance that these forward-looking statements will prove to be accurate. This cautionary statement is applicable to all forward-looking statements contained in this release.
|
ZIMMER BIOMET HOLDINGS, INC. |
|||
|
CONSOLIDATED STATEMENTS OF EARNINGS |
|||
|
FOR THE THREE MONTHS ENDED JUNE 30, 2017 and 2016 |
|||
|
(in millions, except per share amounts, unaudited) |
|||
|
2017 |
2016 |
||
|
Net Sales |
$ 1,954.4 |
$ 1,934.0 |
|
|
Cost of products sold, excluding intangible asset amortization |
527.7 |
640.1 |
|
|
Intangible asset amortization |
147.7 |
133.8 |
|
|
Research and development |
90.1 |
88.6 |
|
|
Selling, general and administrative |
748.0 |
732.0 |
|
|
Special items |
158.6 |
137.9 |
|
|
Operating expenses |
1,672.1 |
1,732.4 |
|
|
Operating Profit |
282.3 |
201.6 |
|
|
Other expense, net |
(3.9) |
(3.8) |
|
|
Interest income |
0.3 |
0.8 |
|
|
Interest expense |
(82.3) |
(88.1) |
|
|
Earnings before income taxes |
196.4 |
110.5 |
|
|
Provision for income taxes |
12.3 |
142.2 |
|
|
Net Earnings (Loss) |
184.1 |
(31.7) |
|
|
Less: Net Loss attributable to noncontrolling interest |
(0.1) |
(0.4) |
|
|
Net Earnings (Loss) of Zimmer Biomet Holdings, Inc. |
$ 184.2 |
$ (31.3) |
|
|
Earnings (Loss) Per Common Share |
|||
|
Basic |
$ 0.91 |
$ (0.16) |
|
|
Diluted |
$ 0.90 |
$ (0.16) |
|
|
Weighted Average Common Shares Outstanding |
|||
|
Basic |
201.8 |
199.4 |
|
|
Diluted |
203.7 |
199.4 |
|
|
Cash Dividends Declared Per Common Share |
$ 0.24 |
$ 0.24 |
|
|
ZIMMER BIOMET HOLDINGS, INC. |
||||
|
CONSOLIDATED STATEMENTS OF EARNINGS |
||||
|
FOR THE SIX MONTHS ENDED JUNE 30, 2017 and 2016 |
||||
|
(in millions, except per share amounts, unaudited) |
||||
|
2017 |
2016 |
|||
|
Net Sales |
$ 3,931.7 |
$ 3,838.0 |
||
|
Cost of products sold, excluding intangible asset amortization |
1,040.6 |
1,280.7 |
||
|
Intangible asset amortization |
299.7 |
260.4 |
||
|
Research and development |
181.2 |
174.3 |
||
|
Selling, general and administrative |
1,508.8 |
1,448.9 |
||
|
Special items |
268.7 |
226.6 |
||
|
Operating expenses |
3,299.0 |
3,390.9 |
||
|
Operating Profit |
632.7 |
447.1 |
||
|
Other expense, net |
(6.7) |
(7.6) |
||
|
Interest income |
0.8 |
2.1 |
||
|
Interest expense |
(165.2) |
(176.3) |
||
|
Earnings before income taxes |
461.6 |
265.3 |
||
|
(Benefit) provision for income taxes |
(21.8) |
188.3 |
||
|
Net Earnings |
483.4 |
77.0 |
||
|
Less: Net Loss attributable to noncontrolling interest |
(0.2) |
(0.5) |
||
|
Net Earnings of Zimmer Biomet Holdings, Inc. |
$ 483.6 |
$ 77.5 |
||
|
Earnings Per Common Share |
||||
|
Basic |
$ 2.40 |
$ 0.39 |
||
|
Diluted |
$ 2.38 |
$ 0.38 |
||
|
Weighted Average Common Shares Outstanding |
||||
|
Basic |
201.4 |
199.8 |
||
|
Diluted |
203.4 |
202.1 |
||
|
Cash Dividends Declared Per Common Share |
$ 0.48 |
$ 0.48 |
||
|
ZIMMER BIOMET HOLDINGS, INC. |
||||||
|
CONDENSED CONSOLIDATED BALANCE SHEETS |
||||||
|
(in millions, unaudited) |
||||||
|
June 30, |
December 31, |
|||||
|
2017 |
2016 |
|||||
|
Assets |
||||||
|
Current Assets: |
||||||
|
Cash and cash equivalents |
$ 450.0 |
$ 634.1 |
||||
|
Receivables, net |
1,464.0 |
1,604.4 |
||||
|
Inventories |
2,023.9 |
1,959.4 |
||||
|
Other current assets |
527.2 |
465.7 |
||||
|
Total current assets |
4,465.1 |
4,663.6 |
||||
|
Property, plant and equipment, net |
2,057.4 |
2,037.9 |
||||
|
Goodwill |
10,859.5 |
10,643.9 |
||||
|
Intangible assets, net |
8,544.0 |
8,785.4 |
||||
|
Other assets |
568.2 |
553.6 |
||||
|
Total Assets |
$ 26,494.2 |
$ 26,684.4 |
||||
|
Liabilities and Stockholders’ Equity |
||||||
|
Current liabilities |
$ 1,708.1 |
$ 1,805.9 |
||||
|
Current portion of long-term debt |
1,329.3 |
575.6 |
||||
|
Other long-term liabilities |
3,822.9 |
3,967.2 |
||||
|
Long-term debt |
9,354.4 |
10,665.8 |
||||
|
Stockholders’ equity |
10,279.5 |
9,669.9 |
||||
|
Total Liabilities and Stockholders’ Equity |
$ 26,494.2 |
$ 26,684.4 |
||||
|
ZIMMER BIOMET HOLDINGS, INC. |
||||||
|
CONSOLIDATED STATEMENTS OF CASH FLOWS |
||||||
|
FOR THE SIX MONTHS ENDED JUNE 30, 2017 and 2016 |
||||||
|
(in millions, unaudited) |
||||||
|
2017 |
2016 |
|||||
|
Cash flows provided by (used in) operating activities |
||||||
|
Net earnings |
$ 483.4 |
$ 77.0 |
||||
|
Depreciation and amortization |
531.7 |
499.2 |
||||
|
Share-based compensation |
27.7 |
30.7 |
||||
|
Intangible asset impairment |
26.8 |
28.0 |
||||
|
Inventory step-up |
30.9 |
286.4 |
||||
|
Changes in operating assets and liabilities, net of acquired assets and liabilities |
||||||
|
Income taxes |
(210.4) |
13.6 |
||||
|
Receivables |
187.8 |
(120.8) |
||||
|
Inventories |
(68.8) |
60.2 |
||||
|
Accounts payable and accrued expenses |
(162.7) |
(141.9) |
||||
|
Other assets and liabilities |
(130.5) |
(80.0) |
||||
|
Net cash provided by operating activities |
715.9 |
652.4 |
||||
|
Cash flows provided by (used in) investing activities |
||||||
|
Additions to instruments |
(172.6) |
(157.3) |
||||
|
Additions to other property, plant and equipment |
(73.8) |
(73.7) |
||||
|
Purchases of investments |
– |
(1.2) |
||||
|
Sales of investments |
– |
273.3 |
||||
|
Business combination investments, net of acquired cash |
(4.0) |
(184.1) |
||||
|
Other investing activities |
(11.7) |
(27.4) |
||||
|
Net cash used in investing activities |
(262.1) |
(170.4) |
||||
|
Cash flows provided by (used in) financing activities |
||||||
|
Proceeds from multicurrency revolving facility |
400.0 |
– |
||||
|
Payments on multicurrency revolving facility |
(400.0) |
– |
||||
|
Redemption of senior notes |
(500.0) |
– |
||||
|
Payments on term loan |
(150.0) |
(500.0) |
||||
|
Net payments on other debt |
(0.7) |
(18.8) |
||||
|
Dividends paid to stockholders |
(96.5) |
(92.4) |
||||
|
Proceeds from employee stock compensation plans |
105.5 |
78.6 |
||||
|
Business combination contingent consideration payments |
(8.1) |
– |
||||
|
Restricted stock witholdings |
(7.1) |
(5.2) |
||||
|
Repurchase of common stock |
– |
(415.5) |
||||
|
Net cash used in financing activities |
(656.9) |
(953.3) |
||||
|
Effect of exchange rates on cash and cash equivalents |
19.0 |
(11.7) |
||||
|
– |
||||||
|
Decrease in cash and cash equivalents |
(184.1) |
(483.0) |
||||
|
Cash and cash equivalents, beginning of period |
634.1 |
1,459.3 |
||||
|
Cash and cash equivalents, end of period |
$ 450.0 |
$ 976.3 |
||||
|
ZIMMER BIOMET HOLDINGS, INC. |
||||||||||||
|
NET SALES BY GEOGRAPHY |
||||||||||||
|
FOR THE THREE AND SIX MONTHS ENDED JUNE 30, 2017 and 2016 |
||||||||||||
|
(in millions, unaudited) |
||||||||||||
|
Three Months Ended June 30, |
Six Months Ended June 30, |
|||||||||||
|
2017 |
2016 |
% Inc / (Dec) |
2017 |
2016 |
% Inc / (Dec) |
|||||||
|
Americas |
$ 1,208.8 |
$ 1,181.0 |
2.3 % |
$ 2,443.6 |
$ 2,358.2 |
3.6 % |
||||||
|
EMEA |
438.2 |
460.9 |
(4.9) |
891.4 |
917.2 |
(2.8) |
||||||
|
Asia Pacific |
307.4 |
292.1 |
5.3 |
596.7 |
562.6 |
6.1 |
||||||
|
Total |
$ 1,954.4 |
$ 1,934.0 |
1.1 |
$ 3,931.7 |
$ 3,838.0 |
2.4 |
||||||
|
ZIMMER BIOMET HOLDINGS, INC. |
||||||||||||
|
NET SALES BY PRODUCT CATEGORY |
||||||||||||
|
FOR THE THREE AND SIX MONTHS ENDED JUNE 30, 2017 and 2016 |
||||||||||||
|
(in millions, unaudited) |
||||||||||||
|
Three Months Ended June 30, |
Six Months Ended June 30, |
|||||||||||
|
2017 |
2016 |
% Inc / (Dec) |
2017 |
2016 |
% Inc / (Dec) |
|||||||
|
Knees |
$ 680.4 |
$ 697.0 |
(2.4) % |
$ 1,382.2 |
$ 1,400.2 |
(1.3) % |
||||||
|
Hips |
469.8 |
477.2 |
(1.5) |
945.5 |
945.1 |
– |
||||||
|
S.E.T |
422.8 |
412.2 |
2.6 |
847.9 |
813.2 |
4.3 |
||||||
|
Dental |
110.4 |
118.0 |
(6.4) |
218.2 |
226.6 |
(3.7) |
||||||
|
Spine & CMF |
194.0 |
145.8 |
33.0 |
380.3 |
287.0 |
32.5 |
||||||
|
Other |
77.0 |
83.8 |
(8.0) |
157.6 |
165.9 |
(4.9) |
||||||
|
Total |
$ 1,954.4 |
$ 1,934.0 |
1.1 |
$ 3,931.7 |
$ 3,838.0 |
2.4 |
||||||
|
ZIMMER BIOMET HOLDINGS, INC. |
||||||||||
|
RECONCILIATION OF REPORTED NET SALES % CHANGE TO |
||||||||||
|
CONSTANT CURRENCY % CHANGE AND |
||||||||||
|
% CHANGE EXCLUDING LDR HOLDING CORPORATION |
||||||||||
|
(unaudited) |
||||||||||
|
For the Three Months Ended |
||||||||||
|
June 30, 2017 |
||||||||||
|
Foreign |
Constant |
|||||||||
|
Exchange |
Currency |
|||||||||
|
% Change |
Impact |
% Change |
||||||||
|
Geographic Results |
||||||||||
|
Americas |
2.3 |
% |
(0.2) |
% |
2.5 |
% |
||||
|
EMEA |
(4.9) |
(3.1) |
(1.8) |
|||||||
|
Asia Pacific |
5.3 |
(1.5) |
6.8 |
|||||||
|
Total |
1.1 |
% |
(1.0) |
% |
2.1 |
% |
||||
|
Product Categories |
||||||||||
|
Knees |
||||||||||
|
Americas |
(2.7) |
% |
(0.1) |
% |
(2.6) |
% |
||||
|
EMEA |
(5.3) |
(3.6) |
(1.7) |
|||||||
|
Asia Pacific |
3.4 |
(0.8) |
4.2 |
|||||||
|
Total |
(2.4) |
(1.1) |
(1.3) |
|||||||
|
Hips |
||||||||||
|
Americas |
(1.4) |
(0.2) |
(1.2) |
|||||||
|
EMEA |
(5.7) |
(2.7) |
(3.0) |
|||||||
|
Asia Pacific |
4.4 |
(2.2) |
6.6 |
|||||||
|
Total |
(1.5) |
(1.3) |
(0.2) |
|||||||
|
– |
||||||||||
|
S.E.T |
2.6 |
(1.0) |
3.6 |
|||||||
|
– |
||||||||||
|
Dental |
(6.4) |
(0.7) |
(5.7) |
|||||||
|
– |
||||||||||
|
Spine & CMF |
33.0 |
(0.5) |
33.5 |
|||||||
|
– |
– |
|||||||||
|
Other |
(8.0) |
(1.0) |
(7.0) |
|||||||
|
– |
||||||||||
|
Net Sales % Change |
1.1 |
% |
(1.0) |
% |
2.1 |
% |
||||
|
– |
||||||||||
|
Impact of LDR Holding Corporation |
(2.4) |
– |
(2.4) |
|||||||
|
% Change excluding LDR Holding Corporation |
(1.3) |
% |
(1.0) |
% |
(0.3) |
% |
||||
|
ZIMMER BIOMET HOLDINGS, INC. |
||||||||||
|
RECONCILIATION OF REPORTED NET SALES % CHANGE TO |
||||||||||
|
CONSTANT CURRENCY % CHANGE AND |
||||||||||
|
% CHANGE EXCLUDING LDR HOLDING CORPORATION |
||||||||||
|
(unaudited) |
||||||||||
|
For the Six Months Ended |
||||||||||
|
June 30, 2017 |
||||||||||
|
Foreign |
Constant |
|||||||||
|
Exchange |
Currency |
|||||||||
|
% Change |
Impact |
% Change |
||||||||
|
Geographic Results |
||||||||||
|
Americas |
3.6 |
% |
– |
% |
3.6 |
% |
||||
|
EMEA |
(2.8) |
(3.4) |
0.6 |
|||||||
|
Asia Pacific |
6.1 |
(0.3) |
6.4 |
|||||||
|
Total |
2.4 |
% |
(0.9) |
% |
3.3 |
% |
||||
|
Product Categories |
||||||||||
|
Knees |
||||||||||
|
Americas |
(1.4) |
% |
– |
% |
(1.4) |
% |
||||
|
EMEA |
(4.4) |
(4.0) |
(0.4) |
|||||||
|
Asia Pacific |
4.1 |
0.4 |
3.7 |
|||||||
|
Total |
(1.3) |
(0.9) |
(0.4) |
|||||||
|
Hips |
||||||||||
|
Americas |
(0.6) |
– |
(0.6) |
|||||||
|
EMEA |
(3.1) |
(2.9) |
(0.2) |
|||||||
|
Asia Pacific |
6.9 |
(0.9) |
7.8 |
|||||||
|
Total |
– |
(1.1) |
1.1 |
|||||||
|
S.E.T |
4.3 |
(0.7) |
5.0 |
|||||||
|
Dental |
(3.7) |
(0.8) |
(2.9) |
|||||||
|
Spine & CMF |
32.5 |
(0.3) |
32.8 |
|||||||
|
– |
||||||||||
|
Other |
(4.9) |
(0.8) |
(4.1) |
|||||||
|
Total |
2.4 |
% |
(0.9) |
% |
3.3 |
% |
||||
|
Impact of LDR Holding Corporation |
(2.3) |
– |
(2.3) |
|||||||
|
% Change excluding LDR Holding Corporation |
0.1 |
% |
(0.9) |
% |
1.0 |
% |
||||
|
ZIMMER BIOMET HOLDINGS, INC. |
|||||
|
RECONCILIATION OF NET EARNINGS TO ADJUSTED NET EARNINGS |
|||||
|
FOR THE THREE MONTHS ENDED JUNE 30, 2017 and 2016 |
|||||
|
(in millions, unaudited) |
|||||
|
Three Months |
|||||
|
Ended June 30, |
|||||
|
2017 |
2016 |
||||
|
Net Earnings of Zimmer Biomet Holdings, Inc. |
$ 184.2 |
$ (31.3) |
|||
|
Inventory step-up and other inventory |
|||||
|
and manufacturing-related charges |
24.9 |
156.6 |
|||
|
Intangible asset amortization |
147.7 |
133.8 |
|||
|
Special items |
|||||
|
Biomet merger-related |
88.2 |
120.6 |
|||
|
Other special items |
70.4 |
17.3 |
|||
|
Merger-related and other (income) expense in other expense, net |
(0.6) |
1.5 |
|||
|
Taxes on above items (1) |
(102.2) |
(96.3) |
|||
|
Biomet merger-related measurement period tax adjustments (2) |
– |
73.2 |
|||
|
Other certain tax adjustments(3) |
12.0 |
31.7 |
|||
|
Adjusted Net Earnings |
$ 424.6 |
$ 407.1 |
|||
|
(1) The tax effect for the U.S. jurisdiction is calculated based on an effective rate considering federal and state taxes, |
|||||
|
as well as permanent items. For jurisdictions outside the U.S., the tax effect is calculated based upon the statutory |
|||||
|
rates where the items were incurred. |
|||||
|
(2) The 2016 period includes negative effects from finalizing the tax accounts for the Biomet merger. Under the |
|||||
|
applicable U.S. GAAP rules, these measurement period adjustments are recognized on a prospective basis |
|||||
|
in the period of change. |
|||||
|
(3) In 2017, other certain tax adjustments relate to charges from internal restructuring transactions that provide the |
|||||
|
Company access to cash in a tax efficient manner partially offset by net favorable resolutions of various tax matters. |
|||||
|
The 2016 adjustment relates to internal restructuring transactions that provide the Company access to cash in |
|||||
|
a tax efficient manner. |
|||||
|
ZIMMER BIOMET HOLDINGS, INC. |
|||||
|
RECONCILIATION OF NET EARNINGS TO ADJUSTED NET EARNINGS |
|||||
|
FOR THE SIX MONTHS ENDED JUNE 30, 2017 and 2016 |
|||||
|
(in millions, unaudited) |
|||||
|
Six Months |
|||||
|
Ended June 30, |
|||||
|
2017 |
2016 |
||||
|
Net Earnings of Zimmer Biomet Holdings, Inc. |
$ 483.6 |
$ 77.5 |
|||
|
Inventory step-up and other inventory |
|||||
|
and manufacturing-related charges |
48.1 |
334.9 |
|||
|
Intangible asset amortization |
299.7 |
260.4 |
|||
|
Special items |
|||||
|
Biomet merger-related |
125.2 |
199.7 |
|||
|
Other special items |
143.5 |
26.9 |
|||
|
Merger-related and other expense in other expense, net |
0.9 |
1.5 |
|||
|
Taxes on above items (1) |
(185.2) |
(185.3) |
|||
|
Biomet merger-related measurement period tax adjustments (2) |
– |
52.7 |
|||
|
Other certain tax adjustments(3) |
(57.8) |
46.0 |
|||
|
Adjusted Net Earnings |
$ 858.0 |
$ 814.3 |
|||
|
(1) The tax effect for the U.S. jurisdiction is calculated based on an effective rate considering federal and state taxes, |
|||||
|
as well as permanent items. For jurisdictions outside the U.S., the tax effect is calculated based upon the statutory |
|||||
|
rates where the items were incurred. |
|||||
|
(2) The 2016 period includes negative effects from finalizing the tax accounts for the Biomet merger. Under the |
|||||
|
applicable U.S. GAAP rules, these measurement period adjustments are recognized on a prospective basis |
|||||
|
in the period of change. |
|||||
|
(3) In 2017, other certain tax adjustments relate to a tax restructuring that lowered the tax rate on deferred tax liabilities |
|||||
|
recorded on intangible assets recognized in acquisition-related accounting, net favorable resolutions of various tax |
|||||
|
matters, and charges from internal restructuring transactions that provide the Company access to cash in a tax efficient |
|||||
|
manner. The 2016 adjustment relates to internal restructuring transactions that provide the Company access to |
|||||
|
cash in a tax efficient manner. |
|||||
|
ZIMMER BIOMET HOLDINGS, INC. |
||||
|
RECONCILIATION OF DILUTED EPS TO ADJUSTED DILUTED EPS |
||||
|
FOR THE THREE MONTHS ENDED JUNE 30, 2017 and 2016 |
||||
|
(unaudited) |
||||
|
Three Months |
||||
|
Ended June 30, |
||||
|
2017 |
2016 |
|||
|
Diluted EPS |
$ 0.90 |
$ (0.16) |
||
|
Inventory step-up and other inventory |
||||
|
and manufacturing-related charges |
0.12 |
0.77 |
||
|
Intangible asset amortization |
0.73 |
0.66 |
||
|
Special items |
||||
|
Biomet merger-related |
0.43 |
0.60 |
||
|
Other special items |
0.35 |
0.09 |
||
|
Merger-related expense in other expense, net |
– |
0.01 |
||
|
Taxes on above items (1) |
(0.51) |
(0.48) |
||
|
Biomet merger-related measurement period tax adjustments (2) |
– |
0.36 |
||
|
Other certain tax adjustments(3) |
0.06 |
0.16 |
||
|
Effect of dilutive shares assuming net earnings (4) |
– |
0.01 |
||
|
Adjusted Diluted EPS |
$ 2.08 |
$ 2.02 |
||
|
(1) The tax effect for the U.S. jurisdiction is calculated based on an effective rate considering federal and state taxes, |
||||
|
as well as permanent items. For jurisdictions outside the U.S., the tax effect is calculated based upon the statutory |
||||
|
rates where the items were incurred. |
||||
|
(2) The 2016 period includes negative effects from finalizing the tax accounts for the Biomet merger. Under the |
||||
|
applicable U.S. GAAP rules, these measurement period adjustments are recognized on a prospective basis |
||||
|
in the period of change. |
||||
|
(3) In 2017, other certain tax adjustments relate to charges from internal restructuring transactions that provide the |
||||
|
Company access to cash in a tax efficient manner partially offset by net favorable resolutions of various tax matters. |
||||
|
The 2016 adjustment relates to internal restructuring transactions that provide the Company access to cash in |
||||
|
a tax efficient manner. |
||||
|
(4) Diluted share count used in Adjusted Diluted EPS: |
Three Months Ended |
|||
|
Diluted shares |
199.4 |
|||
|
Dilutive shares assuming net earnings |
2.5 |
|||
|
Adjusted diluted shares |
201.9 |
|||
|
ZIMMER BIOMET HOLDINGS, INC. |
||||
|
RECONCILIATION OF DILUTED EPS TO ADJUSTED DILUTED EPS |
||||
|
FOR THE SIX MONTHS ENDED JUNE 30, 2017 and 2016 |
||||
|
(unaudited) |
||||
|
Six Months |
||||
|
Ended June 30, |
||||
|
2017 |
2016 |
|||
|
Diluted EPS |
$ 2.38 |
$ 0.38 |
||
|
Inventory step-up and other inventory |
||||
|
and manufacturing-related charges |
0.24 |
1.66 |
||
|
Intangible asset amortization |
1.47 |
1.29 |
||
|
Special items |
||||
|
Biomet merger-related |
0.62 |
0.98 |
||
|
Other special items |
0.71 |
0.13 |
||
|
Merger-related and other expense in other (expense) income, net |
– |
0.01 |
||
|
Taxes on above items (1) |
(0.91) |
(0.91) |
||
|
Biomet merger-related measurement period tax adjustments (2) |
– |
0.26 |
||
|
Other certain tax adjustments(3) |
(0.29) |
0.23 |
||
|
Adjusted Diluted EPS |
$ 4.22 |
$ 4.03 |
||
|
(1) The tax effect for the U.S. jurisdiction is calculated based on an effective rate considering federal and state taxes, |
||||
|
as well as permanent items. For jurisdictions outside the U.S., the tax effect is calculated based upon the statutory |
||||
|
rates where the items were incurred. |
||||
|
(2) The 2016 period includes negative effects from finalizing the tax accounts for the Biomet merger. Under the |
||||
|
applicable U.S. GAAP rules, these measurement period adjustments are recognized on a prospective basis |
||||
|
in the period of change. |
||||
|
(3) In 2017, other certain tax adjustments relate to a tax restructuring that lowered the tax rate on deferred tax liabilities |
||||
|
recorded on intangible assets recognized in acquisition-related accounting, net favorable resolutions of various tax |
||||
|
matters, and charges from internal restructuring transactions that provide the Company access to cash in a tax efficient |
||||
|
manner. The 2016 adjustment relates to internal restructuring transactions that provide the Company access to |
||||
|
cash in a tax efficient manner. |
||||
|
ZIMMER BIOMET HOLDINGS, INC. |
||||||||||
|
SUMMARY OF EXPENSES INCLUDED IN SPECIAL ITEMS |
||||||||||
|
FOR THE THREE AND SIX MONTHS ENDED JUNE 30, 2017 and 2016 |
||||||||||
|
(in millions, unaudited) |
||||||||||
|
Three Months |
Six Months |
|||||||||
|
Ended June 30, |
Ended June 30, |
|||||||||
|
2017 |
2016 |
2017 |
2016 |
|||||||
|
Biomet merger-related |
||||||||||
|
Consulting and professional fees |
$ 22.1 |
$ 43.3 |
$ 40.8 |
$ 79.4 |
||||||
|
Employee termination benefits |
9.6 |
3.1 |
6.6 |
7.2 |
||||||
|
Dedicated project personnel |
14.2 |
21.2 |
22.9 |
42.9 |
||||||
|
Relocated facilities |
1.5 |
6.3 |
4.3 |
8.0 |
||||||
|
Contract terminations |
– |
15.2 |
– |
25.3 |
||||||
|
Information technology integration |
1.3 |
3.1 |
3.6 |
4.5 |
||||||
|
Intangible asset impairment |
26.8 |
28.0 |
26.8 |
28.0 |
||||||
|
Other |
12.7 |
0.4 |
20.2 |
4.4 |
||||||
|
Total Biomet merger-related |
88.2 |
120.6 |
125.2 |
199.7 |
||||||
|
Other |
||||||||||
|
Consulting and professional fees |
51.7 |
8.8 |
102.1 |
15.7 |
||||||
|
Employee termination benefits |
1.4 |
– |
2.6 |
– |
||||||
|
Dedicated project personnel |
8.7 |
1.5 |
21.5 |
3.3 |
||||||
|
Relocated facilities |
0.1 |
– |
2.5 |
0.2 |
||||||
|
Certain litigation matters |
– |
– |
7.0 |
– |
||||||
|
Contract terminations |
– |
1.0 |
– |
1.0 |
||||||
|
Information technology integration |
0.3 |
0.2 |
0.8 |
0.3 |
||||||
|
Certain R&D agreements |
2.5 |
– |
2.5 |
– |
||||||
|
Loss/impairment on assets |
– |
1.1 |
– |
1.1 |
||||||
|
Contingent consideration adjustments |
0.4 |
– |
(3.2) |
– |
||||||
|
Other |
5.3 |
4.7 |
7.7 |
5.3 |
||||||
|
Total Other |
70.4 |
17.3 |
143.5 |
26.9 |
||||||
|
Special items |
$ 158.6 |
$ 137.9 |
$ 268.7 |
$ 226.6 |
||||||
|
ZIMMER BIOMET HOLDINGS, INC. |
|||||
|
RECONCILIATION OF 2017 PROJECTED REVENUE % CHANGE TO |
|||||
|
2017 PROJECTED CONSTANT CURRENCY % CHANGE AND |
|||||
|
CHANGE EXCLUDING LDR HOLDING CORPORATION |
|||||
|
(unaudited) |
|||||
|
Projected Three Months Ended September 30, 2017: |
High |
Low |
|||
|
Revenue % change |
0.5 |
% |
(1.0) |
% |
|
|
Foreign exchange impact |
0.5 |
0.5 |
|||
|
Constant currency % change |
1.0 |
% |
(0.5) |
% |
|
|
Impact of LDR Holding Corporation |
(0.3) |
(0.3) |
|||
|
Constant currency % change excluding LDR Holding Corporation |
0.7 |
% |
(0.8) |
% |
|
|
Projected Year Ended December 31, 2017: |
High |
Low |
|||
|
Revenue % change |
2.4 |
% |
1.5 |
% |
|
|
Foreign exchange impact |
0.3 |
0.3 |
|||
|
Constant currency % change |
2.7 |
% |
1.8 |
% |
|
|
Impact of LDR Holding Corporation |
(1.2) |
(1.2) |
|||
|
Constant currency % change excluding LDR Holding Corporation |
1.5 |
% |
0.6 |
% |
|
|
ZIMMER BIOMET HOLDINGS, INC. |
|||
|
RECONCILIATION OF 2017 PROJECTED DILUTED EPS |
|||
|
AND PROJECTED ADJUSTED DILUTED EPS |
|||
|
(unaudited) |
|||
|
Projected Three Months Ended September 30, 2017: |
High |
Low |
|
|
Diluted EPS |
$ 0.70 |
$ 0.60 |
|
|
Inventory step-up and other inventory and manufacturing related |
|||
|
charges, intangible asset amortization, special items and other expense |
1.51 |
1.58 |
|
|
Taxes on above items(1) and other certain tax adjustments |
(0.44) |
(0.46) |
|
|
Adjusted Diluted EPS |
$ 1.77 |
$ 1.72 |
|
|
Projected Year Ended December 31, 2017: |
High |
Low |
|
|
Diluted EPS |
$ 4.35 |
$ 4.15 |
|
|
Inventory step-up and other inventory and manufacturing related |
|||
|
charges, intangible asset amortization, special items and other expense |
6.08 |
6.23 |
|
|
Taxes on above items(1) and other certain tax adjustments |
(2.13) |
(2.18) |
|
|
Adjusted Diluted EPS |
$ 8.30 |
$ 8.20 |
|
|
(1) The tax effect for the U.S. jurisdiction is estimated based on an effective rate considering federal and state taxes, |
|||
|
as well as permanent items. For jurisdictions outside the U.S., the tax effect is estimated based upon the statutory |
|||
|
rates where the items are projected to be incurred. |
|||
SOURCE Zimmer Biomet Holdings, Inc.
NEW YORK, July 27, 2017 /PRNewswire/ — 4WEB Medical, the industry leader in 3D printed implant technology, announced today the first surgeries utilizing the company’s Lateral Spine Truss System were recently performed in several notable hospitals in the United States. The company’s lateral interbody fusion device was designed to solve known surgical problems associated with legacy annular implant designs and represents a significant advancement in lateral access surgery.
“4WEB’s spine truss implants have proven to be very effective in providing excellent surgical outcomes for my patients,” said Frank Cammisa, MD, Hospital for Special Surgery, New York, NY. “In contrast to older ring-shaped implants with hollow cores, 4WEB’s truss implant web structure spans the entire endplate providing strong initial fixation and minimizing subsidence.”
The Lateral Spine Truss System is designed with a unique bi-convex dome that distributes load across a larger surface area and has three times more textured surface topography when compared to other competitive spine implants. The key differentiator for the product, though, is its proprietary truss design and the performance it lends to driving successful spine fusion results.
“A recent study comparing 4WEB’s lateral truss implant to a ring implant design demonstrated that the truss design had superior resistance to subsidence,” said John Peloza, MD, Center for Spine Care, Dallas, Texas. “In fact, the 40mm length truss implant displayed 61% greater resistance to subsidence than the 60mm length ring implant1. These results are indicative of the optimized load distribution inherent to 4WEB’s truss implant technology that maximizes endplate contact while providing an open architecture for bone formation and fusion.”
4WEB Medical is an implant device company founded in 2008 in Dallas, Texas. Thirty years of research in topological dimension theory led to the discovery of a novel geometry, the 4WEB, that can be used as a building block to create high-strength, lightweight web structures. The company leveraged this breakthrough along with cutting-edge 3D printing technology to develop 4WEB Medical’s proprietary truss implant platform. The 4WEB Medical product portfolio includes the Cervical Spine Truss System, the ALIF Spine Truss System, the Posterior Spine Truss System, the Lateral Spine Truss System, and the Osteotomy Truss System. 4WEB is actively developing truss implant designs for knee, hip, trauma and patient specific orthopedic procedures.
For more information about 4WEB Medical, 4WEB’s Truss Implant Technology, and the Spine Truss Systems, please visit www.4WEBMedical.com.
SOURCE 4WEB Medical

July 27, 2017
BEDFORD, Mass.–(BUSINESS WIRE)–Anika Therapeutics, Inc. (NASDAQ: ANIK), a global, integrated orthopedic medicines company specializing in therapeutics based on its proprietary hyaluronic acid (“HA”) technology, today announced the appointment of Joseph Darling, an orthopedic and medical device veteran with broad commercial experience, to the role of President. For the past 15 years, the Company’s Chief Executive Officer (CEO), Dr. Charles H. Sherwood served as President and plans to transition the role to Mr. Darling, while continuing his tenure as CEO. Mr. Darling brings more than 20 years of executive management and leadership experience from publicly-traded, commercial-stage companies including Baxter Healthcare, Smith & Nephew, ConMed, and Wyeth-Ayerst.
“Anika is at the cusp of a transformation. We are ushering in the next decade of growth through the build-out of a direct commercialization capability, a steady march of global expansion, and a pipeline that includes multiple potential blockbuster products,” said Charles H. Sherwood, Ph.D., Chief Executive Officer of Anika Therapeutics. “With his established track record overseeing global sales and marketing efforts at leading medical device companies, Mr. Darling is uniquely suited to help drive continued growth and spearhead Anika’s direct commercialization initiative. The company’s leadership team and our Board are excited for Mr. Darling to bring his deep expertise to the table during this exciting period.”
Most recently, Mr. Darling held executive leadership positions with two small privately held orthopedic companies. Prior to these roles, Mr. Darling held senior level executive positions at ConMed Corporation, a global, publicly-held, diversified medical device company, as Global President of its wholly-owned subsidiary, Linvatec Corporation, and as Executive Vice President of Global Corporate Commercial Operations. At ConMed, Mr. Darling led five global business units with $760 million in annual revenues and refocused organizational efforts in sales, marketing, and R&D.
“Dr. Sherwood and his leadership team have built Anika into an innovative, high growth, profitable, and global orthopedic company with a diversified portfolio that includes differentiated, market-leading therapeutic products and an emerging orthopedic medicine pipeline with tremendous potential,” said Mr. Darling. “I’m excited to join Anika during, what I believe to be, a pivotal moment in its 25-year history. My extensive commercial operations background in the orthopedic sector will prove to be integral to executing the company’s long-term growth strategy.”
Before ConMed, Mr. Darling was Senior Vice President and General Manager for the sports medicine business at Smith & Nephew and played an important role in defining a global strategy that propelled the company to a leadership position in the sports medicine field. Mr. Darling launched his career at Abbott Laboratories and Wyeth-Ayerst Pharmaceuticals, where he held management positions in sales and marketing before joining Baxter Healthcare as a Vice President of marketing and health systems. Mr. Darling holds a Bachelor of Arts in Political Science from Syracuse University. Click HERE to view Mr. Darling’s full bio.
About Anika Therapeutics, Inc.
Anika Therapeutics, Inc. (NASDAQ: ANIK) is a global, integrated orthopedic medicines company based in Bedford, Massachusetts. Anika is committed to improving the lives of patients with degenerative orthopedic diseases and traumatic conditions with clinically meaningful therapies along the continuum of care, from palliative pain management to regenerative cartilage repair. The Company has over two decades of global expertise developing, manufacturing, and commercializing more than 20 products based on its proprietary hyaluronic acid (HA) technology. Anika’s orthopedic medicine portfolio includes ORTHOVISC®, MONOVISC®, and CINGAL®, which alleviate pain and restore joint function by replenishing depleted HA, and HYALOFAST®, a solid HA-based scaffold to aid cartilage repair and regeneration. For more information about Anika, please visit www.anikatherapeutics.com.
Forward-Looking Statements
The statements made in the first and second sentences of the second paragraph of this press release, which are not statements of historical fact, are forward-looking statements within the meaning of Section 27A of the Securities Act of 1933, as amended, and Section 21E of the Securities Exchange Act of 1934, as amended. These statements include, but are not limited to, those relating to the Company’s direct commercial capability, global expansion efforts, and the strength of the Company’s product pipeline. These statements are based upon the current beliefs and expectations of the Company’s management and are subject to significant risks, uncertainties, and other factors. The Company’s actual results could differ materially from any anticipated future results, performance, or achievements described in the forward-looking statements as a result of a number of factors including, but not limited to, (i) the Company’s ability to successfully commence and/or complete clinical trials of its products on a timely basis or at all; (ii) the Company’s ability to obtain pre-clinical or clinical data to support domestic and international pre-market approval applications, 510(k) applications, or new drug applications, or to timely file and receive FDA or other regulatory approvals or clearances of its products; (iii) that such approvals will not be obtained in a timely manner or without the need for additional clinical trials, other testing or regulatory submissions, as applicable; (iv) the Company’s research and product development efforts and their relative success, including whether we have any meaningful sales of any new products resulting from such efforts; (v) the cost effectiveness and efficiency of the Company’s clinical studies, manufacturing operations, and production planning; (vi) the strength of the economies in which the Company operates or will be operating, as well as the political stability of any of those geographic areas; (vii) future determinations by the Company to allocate resources to products and in directions not presently contemplated; (viii) the Company’s ability to successfully commercialize its products, in the U.S. and abroad; (ix) the Company’s ability to provide an adequate and timely supply of its products to its customers; and (x) the Company’s ability to achieve its growth targets. Additional factors and risks are described in the Company’s periodic reports filed with the Securities and Exchange Commission, and they are available on the SEC’s website at www.sec.gov. Forward-looking statements are made based on information available to the Company on the date of this press release, and the Company assumes no obligation to update the information contained in this press release.
For Investor Inquiries:
Anika Therapeutics, Inc.
Sylvia Cheung, 781-457-9000
Chief Financial Officer
or
For Media Inquiries:
Pure Communications
Sonal Vasudev, 917-523-1418
sonal@purecommunicationsinc.com
July 27, 2017
SAN DIEGO–(BUSINESS WIRE)–Samumed, a leader in cartilage regeneration research, today announced the successful completion of a 52-week Phase II clinical trial of its potential treatment for osteoarthritis (“OA”) of the knee. SM04690 is a novel, small molecule inhibitor of the Wnt pathway, administered as an intra-articular injection. SM04690 appeared safe and well-tolerated at all dose levels studied. There were 29 serious adverse events reported, none of which were deemed related to SM04690, as assessed by the investigators. A detailed analysis of 52-week results of this Phase II study, including safety, pain and function scores, and disease modification, will be presented at future medical conferences.
“The completion of our Phase II clinical trial of SM04690 for the potential treatment of OA of the knee marks an important milestone for physicians, patients, and our development program,” said Dr. Yusuf Yazici, Samumed’s Chief Medical Officer. “While the current standard of care is focused on relieving signs and symptoms of the disease, SM04690 has the potential to be the first disease-modifying treatment approved for OA of the knee.”
Samumed presented 26-week interim data last month at the annual European League Against Rheumatism (EULAR) Congress in Madrid, Spain. SM04690, studied as a once annual injection, showed promising efficacy and safety at the six-month timepoint. The product appeared to potentially regrow cartilage, as demonstrated by increased medial joint space width on x-ray of the treated knee, and also appeared to improve both pain and function scores in patients compared to placebo. The presentations can be viewed at: http://bit.ly/2tZVN2lhttp://bit.ly/2sBTimi
SM04690 is in development as a potential disease modifying drug for knee OA (DMOAD) designed to increase chondrocyte production to generate new articular cartilage, reduce protease production to slow down cartilage degradation, and reduce inflammation in the joint. This Phase II trial was a randomized, double-blind, placebo-controlled study, to determine the safety and efficacy of SM04690. The study enrolled across 36 clinical sites in the US a total of 455 patients with moderate-to-severe OA of the knee. Subjects received a single injection of SM04690, with pain and function scores assessed by WOMAC and disease modification assessed by medial joint space width by x-ray. Study details can be reviewed at: http://bit.ly/2eOINuv
About Osteoarthritis (OA)
Arthritis is the most common cause of disability among adults, and OA is the most common type of arthritis, accounting for much of this burden. The overall number of US adults affected by OA in any joint has increased during recent decades, to 27 million in 2005, primarily due to an aging population and an ever-increasing prevalence of obesity. OA is characterized by pain, disability and joint deformity due to articular cartilage degradation and bone remodeling.
About Samumed, LLC
Based in San Diego, CA, Samumed (www.samumed.com) is a pharmaceutical platform company focused on advancing regenerative medicine and oncology applications through research and innovation. Samumed has discovered new targets and biological processes in the Wnt pathway, allowing the team to develop small molecule drugs that potentially address numerous degenerative conditions as well as many forms of cancer.
For Samumed
Chrissy Randall, 202-393-7337
crandall@brunswickgroup.com