Park City, UT

3 days / 6 sessions
Current Issues in Spine

February 2-4, 2017

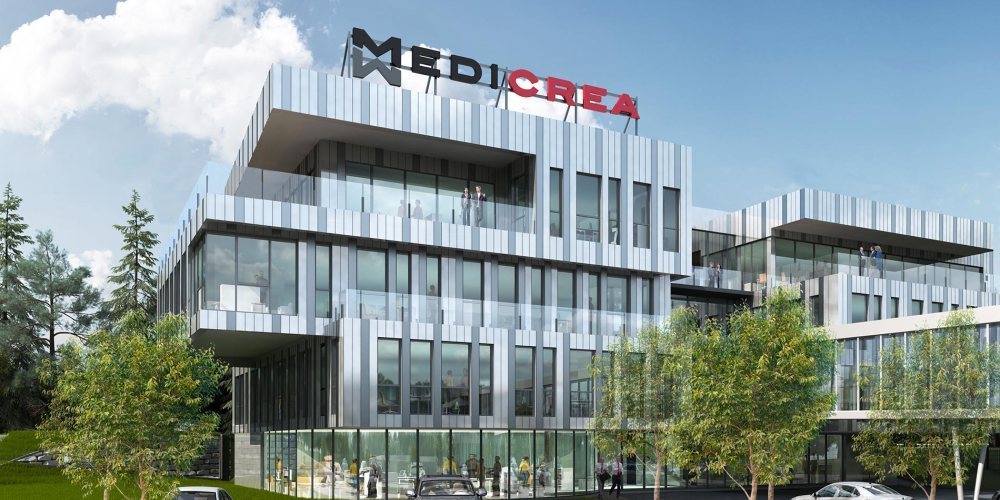
rea-medicrea-5a4276cf1b952a23a2381b1b66a95324546377b474c62e264272afb9a3c02711.jpg

August 1, 2017 OrthoSpineNews

July 31, 2017

LYON, France & NEW YORK–(BUSINESS WIRE)–The Medicrea Group (Euronext Growth Paris: FR0004178572 – ALMED), pioneering the convergence of healthcare IT and next-generation, outcome-centered device design and manufacturing with UNiD™ ASI technology, announced today that the world’s first minimally-invasive spine surgery using patient-specific implants was performed by Dr. C.J. Kleck at the University of Colorado Hospital using the company’s UNiD™ MIS Rod.

The limited visualization of the spine associated with Minimally-Invasive Spine (MIS) techniques poses unique challenges for surgeons whose goal is segmental sagittal balance, while offering known benefits to patients which include reduced muscle damage during surgery and improved recovery time post-operatively. Such advantages have led MIS solutions to be an area of particular growth in the spine market. Surgeons trained in MIS techniques are able to treat a growing number of spinal conditions due to recent advancements in imaging and device offerings. The UNiD™ MIS Rod is the first and only spinal implant in the world that is manufactured specially for the patient prior to minimally-invasive surgery. The UNiD™ MIS Rod is compatible with percutaneous and mini-open MIS applications, removing the need to modify implants intra-operatively.

“As one of the early adopters of UNiD™ ASI, I have seen firsthand the associated benefits of the technology in open deformity cases. I am pleased to extend it now to my MIS cases where I see the potential for increased utility in degenerative indications.” stated Dr. Kleck following the surgery. “With each patient-specific implant designed utilizing Medicrea’s support services, machine learning and predictive analytics, my colleagues and I have seen an improved efficiency in our pre-surgical as well as our surgical practice. I believe this scientific, data-driven model is the best approach available to optimize long-term patient results and represents the future of value-based spinal care.”

Denys Sournac, President and CEO of Medicrea, stated, “We are now able to respond to the growing demand for personalized UNiD™ ASI technology in minimally-invasive surgery by introducing the UNiD™ MIS Rod to our UNiD™ TEK line of FDA-cleared patient-specific implants. We are the only company in Spine able to generate Adaptive Spine Intelligence powered by proprietary data science and remain committed to driving improved outcomes and efficiencies for patients, surgeons, hospitals and payers with our platform of UNiD™ ASI implants, services and IT.”

Today, more than 1,500 UNiD™ Rod surgeries have been performed worldwide. The range of patient-specific implants available as UNiD™ TEK are fully compatible with Medicrea’s platform of innovative procedurally-integrated solutions.

About Medicrea (www.Medicrea.com)

Through the lens of predictive medicine, Medicrea leads the design, integrated manufacture, and distribution of 30+ FDA approved spinal implant technologies that have been utilized in over 100,000 spinal surgeries to date. By leveraging its proprietary software analysis tools with big data and machine learning technologies and supported by an expansive collection of clinical and scientific data, Medicrea is well-placed to streamline the efficiency of spinal care, reduce procedural complications and limit time spent in the operating room.

Operating in a $10 billion marketplace, Medicrea is a Small and Medium sized Enterprise (SME) with 175 employees worldwide, which includes 50 who are based in the U.S. The Company has an ultra-modern manufacturing facility in Lyon, France housing the development and production of 3D-printed titanium patient-specific implants.

For further information, please visit: Medicrea.com.

Connect with Medicrea:
FACEBOOK | INSTAGRAM | TWITTER | WEBSITE | YOUTUBE

Medicrea is listed on
EURONEXT Growth Paris
ISIN: FR 0004178572
Ticker: ALMED

Contacts

Medicrea
Denys Sournac
Founder, Chairman and CEO
dsournac@Medicrea.com
or
Fabrice Kilfiger,
Chief Financial Officer
fkilfiger@Medicrea.com
Tel: +33 (0)4 72 01 87 87


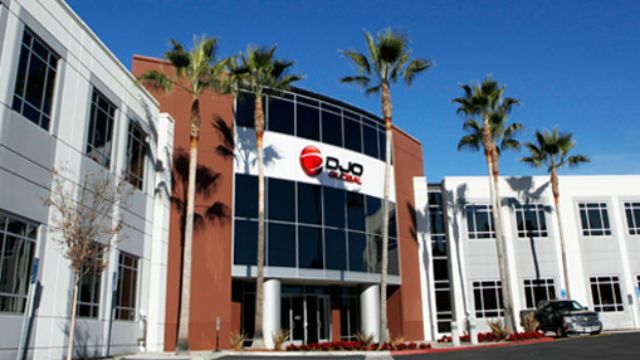
DJO-Global.jpg

August 1, 2017 OrthoSpineNews

August 01, 2017

SAN DIEGO–(BUSINESS WIRE)–DJO Global, Inc., a leading global provider of medical technologies designed to get and keep people moving, today announced the following information for the release of its second quarter 2017 financial results and a conference call to discuss those results.

Date: Thursday, August 10, 2017

Time: Financial Results: 4:05 PM Eastern Time | Conference Call: 4:30 PM Eastern Time; 1:30 PM Pacific Time

Dial In: (866) 394-8509 (International callers please use (706) 643-6833) and use reservation code: 22322226. Please dial in 5 to 10 minutes prior to scheduled start time.

Replay: (855) 859-2056 for all callers. Enter reservation code: 22322226. Replay ends 48 hours after call.

Live Internet: www.DJOglobal.com, accessed through the Investor Relations page of the Company’s website. The webcast will be archived after the completion of the call.

About DJO Global

DJO Global is a leading global provider of medical technologies designed to get and keep people moving. The Company’s products address the continuum of patient care from injury prevention to rehabilitation, enabling people to regain or maintain their natural motion. Its products are used by orthopedic surgeons, primary care physicians, pain management specialists, physical therapists, podiatrists, chiropractors, athletic trainers and other healthcare professionals. In addition, many of the Company’s medical devices and related accessories are used by athletes and patients for injury prevention and at-home physical therapy treatment. The Company’s product lines include rigid and soft orthopedic bracing, hot and cold therapy, bone growth stimulators, vascular therapy systems and compression garments, therapeutic shoes and inserts, electrical stimulators used for pain management and physical therapy products. The Company’s surgical division offers a comprehensive suite of reconstructive joint products for the hip, knee and shoulder. DJO Global’s products are marketed under a portfolio of brands including Aircast®, Chattanooga, CMFTM, Compex®, DonJoy®, ProCare®, DJO® Surgical, Dr. Comfort®, Bell-Horn® and ExosTM. For additional information on the Company, please visit www.DJOglobal.com.

Contacts

DJO Investor/Media Contact:
David Smith
SVP and Treasurer
760.734.3075
ir@djoglobal.com


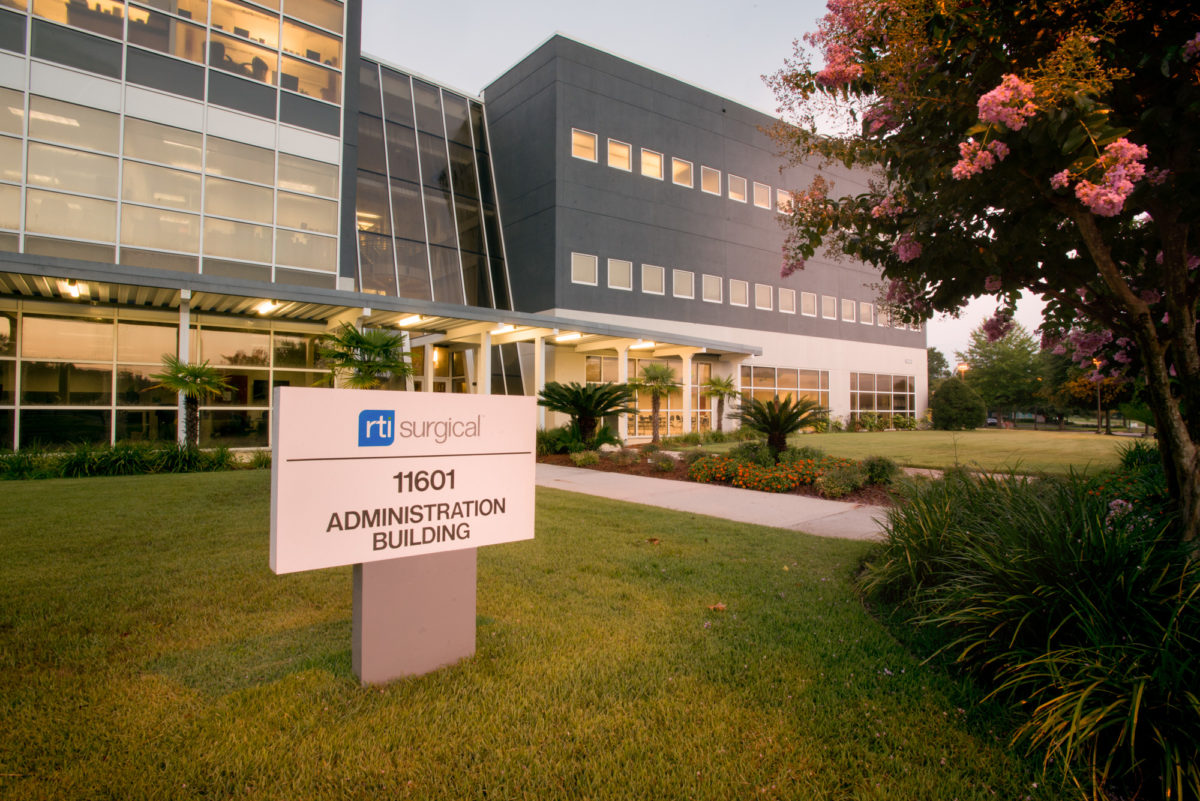
rti-surgical-corporate-photos-45-1200x801.jpg

August 1, 2017 OrthoSpineNews

August 01, 2017

ALACHUA, Fla.–(BUSINESS WIRE)–RTI Surgical Inc. (RTI) (Nasdaq: RTIX), a global surgical implant company, announced today that it plans to release financial results from the second quarter 2017 on Tuesday, August 8, 2017, prior to the market open.

RTI will host a conference call and simultaneous audio webcast to discuss second quarter results at 8:30 a.m. ET the same day. The conference call can be accessed by dialing (877) 383-7419 (U.S.) or (760) 666-3754 (International). The webcast can be accessed through the investor section of RTI’s website at www.rtix.com. A replay of the conference call will be available on RTI’s website for one month following the call.

About RTI Surgical Inc.

RTI Surgical is a leading global surgical implant company providing surgeons with safe biologic, metal and synthetic implants. Committed to delivering a higher standard, RTI’s implants are used in sports medicine, general surgery, spine, orthopedic, trauma and cardiothoracic procedures and are distributed in nearly 50 countries. RTI is headquartered in Alachua, Fla., and has four manufacturing facilities throughout the U.S. and Europe. RTI is accredited in the U.S. by the American Association of Tissue Banks and is a member of AdvaMed. For more information, please visit www.rtix.com.

Forward Looking Statement

This communication contains forward-looking statements within the meaning of the Private Securities Litigation Reform Act of 1995. These forward-looking statements are based on management’s current expectations, estimates and projections about our industry, our management’s beliefs and certain assumptions made by our management. Words such as “anticipates,” “expects,” “intends,” “plans,” “believes,” “seeks,” “estimates,” variations of such words and similar expressions are intended to identify such forward-looking statements. In addition, except for historical information, any statements made in this communication about anticipated financial results, growth rates, new product introductions, future operational improvements and results or regulatory approvals or changes to agreements with distributors also are forward-looking statements. These statements are not guarantees of future performance and are subject to risks and uncertainties, including the risks described in public filings with the U.S. Securities and Exchange Commission (SEC). Our actual results may differ materially from the anticipated results reflected in these forward-looking statements. Copies of the company’s SEC filings may be obtained by contacting the company or the SEC or by visiting RTI’s website at www.rtix.com or the SEC’s website at www.sec.gov.

Contacts

RTI Surgical Inc.
Robert Jordheim, 386-418-8888
Executive Vice President and Chief Financial Officer
rjordheim@rtix.com
or
Roxane Wergin, 386-418-8888
Director, Corporate Communications
rwergin@rtix.com


August 1, 2017 OrthoSpineNews

August 01, 2017

SAN DIEGO–(BUSINESS WIRE)–Samumed, a leader in Wnt research and development, has been selected for an oral presentation at the 2017 Gordon Research Conference, “Wnt Signaling: A Pathway Implicated in Animal Development, Stem Cell Control and Cancer,” to be held in Stowe, Vermont on August 6-11, 2017.

“We are excited to be presenting at the prestigious Gordon Research Conference, which provides an international forum for the discussion of cutting-edge research in life sciences,” said Dr. Yusuf Yazici, Samumed’s Chief Medical Officer. “The preclinical research that formed the basis of our promising investigational drug for the treatment of osteoarthritis is an example of how innovative science can translate into clinical benefit.”

Samumed’s presentation, “Discovery of a Small Molecule Inhibitor of the Wnt Pathway (SM04690) as a Potential Disease Modifying Treatment for Knee Osteoarthritis,” will be available on the company website after the conference at: http://bit.ly/2hhTp68.

About Gordon Research Conferences

Gordon Research Conferences is an organization that coordinates renowned international scientific conferences dedicated to advancing the frontiers of scientific research in the biological, chemical, and physical sciences, and their related technologies. To attend a meeting, scientists must apply to that respective research conference. The conference chair carefully considers every applicant and hand-selects 200 attendees for each conference. Further information can be found at: https://www.grc.org.

About Samumed, LLC

Based in San Diego, CA, Samumed (www.samumed.com) is a pharmaceutical platform company focused on advancing regenerative medicine and oncology applications through research and innovation. Samumed has discovered new targets and biological processes in the Wnt pathway, allowing the team to develop small molecule drugs that potentially address numerous degenerative conditions as well as many forms of cancer.

Contacts

For Samumed
Chrissy Randall, 202-393-7337
crandall@brunswickgroup.com


165_thumb-1.jpg

August 1, 2017 OrthoSpineNews

August 01, 2017

LEXINGTON, Ky.–(BUSINESS WIRE)–Based on 12-month follow-up clinical data from its safety and feasibility study, Intralink-Spine, Inc. (ILS) indicates that the Réjuve™ System continues to effectively eliminate or reduce low back pain and disability associated with degenerative disc disease.

“We continue to be very pleased with the patient outcomes,” states Dr. Tom Hedman, Ph.D., the inventor and Adjunct Associate Professor in the F. Joseph Halcomb III, M.D. Department of Biomedical Engineering at the University of Kentucky. “Twelve months after the Réjuve procedure, three of the four (3/4) patients eligible for this follow-up assessment have no (zero) low back pain and no (zero) disability. And, the fourth patient has minimal pain and disability. These initial clinical results demonstrate a long-lasting, significant reduction or elimination of pain and disability, not just a slight reduction, and these benefits began within days of the initial procedure. We also have objective imaging data demonstrating the elimination of clinical instability. This is great news, especially as we begin our larger pivotal clinical studies.” (Video – Dr. Hedman discusses recent clinical data.)

“With the reduction or elimination of low back pain coming so quickly after the procedure, skeptics were reluctant to believe that the Réjuve treatment would actually stay the course. And, I understand their skepticism, because alternative treatments with good early results have turned out to only be temporary and with biologic treatments, good results require months or years to take effect, if they come at all,” says Lyle Hawkins, CEO of Intralink-Spine, Inc. “Now, they see data from us that patients improve within days of treatment and continue to enjoy a better quality of life 12 months post procedure. So, yes, they were skeptical. However, we’re beginning to turn skeptics into believers.”

According to Hawkins, “We understand that we need to evaluate this injectable device in a much larger group of patients in a multisite study, but we are very optimistic as we pursue that next milestone. We believe the Réjuve System which structurally reinforces the native intervertebral disc itself is going to be a better treatment option for many patients with low back pain. Réjuve has the procedural simplicity of an epidural steroid injection, but with potential long-term positive effects similar to a successful fusion.”

About Intralink-Spine, Inc. (ILS): Formed to manufacture and exclusively sell the Réjuve™ injectable medical device to treat Degenerative Disc Disease (DDD), low back pain, and related spinal diseases such as scoliosis, ILS is currently conducting a Round C fundraising event for accredited investors.

Contacts

Intralink-Spine Inc.
Lyle Hawkins, 502-419-8099
LHawkins@IntralinkSpine.com


mazor-robotics-7x4.jpg

August 1, 2017 OrthoSpineNews

August 1, 2017 – CAESAREA, Israel–(BUSINESS WIRE)–

Mazor Robotics Ltd. (TASE: MZOR; NASDAQGM: MZOR), a pioneer and a leader in the field of surgical guidance systems, reported record second quarter revenue of $15.5 million. As previously announced, the Company received purchase orders for 19 systems in the 2017 second quarter and ended the quarter with a backlog of 14 systems.

“Our Q2 performance is highlighted by record quarterly revenue and a year-over-year increase of 87%, which reflects the market’s excitement for Mazor X and the successful sales execution with our partner,” commented Ori Hadomi, Chief Executive Officer. “The market traction and recognition of the system’s benefits is generating robust demand for our surgical guidance systems, which strengthens our leadership position in the U.S. market. Our sales team is continuing to pursue these opportunities and during the first few weeks of the third quarter we have received purchase orders for six systems.”

SECOND QUARTER 2017 FINANCIAL RESULTS ON IFRS BASIS (“GAAP”)

Revenue for the three months ended June 30, 2017 increased 87% to $15.5 million compared to $8.3 million in the year-ago second quarter. U.S. revenue increased 110% to $14.1 million compared to $6.7 million in the year-ago second quarter, as the Company recognized revenue from 14 Mazor X systems compared to 5 Renaissance systems in the 2016 second quarter. The Company ended the quarter with a backlog of 14 systems, which are expected to be shipped and recorded as revenues in the second half of 2017. International revenue was $1.4 million compared to $1.6 million in the year-ago second quarter. Recurring revenue from kit sales, services and others increased 50% to $6.3 million in the second quarter of 2017 compared to $4.2 million in the year-ago second quarter. The growth is attributed mainly to the increase of the installed base.

The Company’s gross margin for the three months ended June 30, 2017 was 69.4% compared to 76.9% in the year-ago second quarter. This expected decrease is attributed mainly to the higher manufacturing costs of the Mazor X compared to the Renaissance system and the inclusion of four Renaissance trade-ins to Mazor X. Total operating expenses were $14.6 million compared to $10.3 million in the year-ago second quarter primarily reflecting the Company’s increased investment in sales and marketing activities. Operating loss was $3.9 million compared to an operating loss of $4.0 million in the year-ago second quarter. Net loss for the second quarter of 2017 was $3.7 million, or $0.08 per share, compared to a net loss of $4.1 million, or $0.09 per share, for the year-ago second quarter.

Cash used in operating activities during the 2017 second quarter was $7.4 million compared to $0.6 million cash used in operating activities in the year-ago second quarter. The Increase in cash used in the period is due to increase of Accounts receivable and Inventory to support the growing installed base and backlog orders in the second quarter of 2017. As of June 30, 2017, cash, cash equivalents and investments totaled $57.4 million.

SECOND QUARTER 2017 FINANCIAL RESULTS ON NON-GAAP BASIS

The tables below include reconciliation of the Company’s GAAP results to non-GAAP results. The reconciliation relates to non-cash expenses in the amount of $1.3 million with respect to amortization of intangible assets and to share-based expenses recorded in the second quarter of 2017. On a non-GAAP basis, the net loss in the second quarter of 2017 was $2.4 million, or $0.05 per share, compared to $3.9 million, or $0.09 per share, for the year-ago second quarter.

SIX MONTHS ENDED JUNE 30, 2017 FINANCIAL RESULTS ON IFRS BASIS (“GAAP”)

For the six months ended June 30, 2017, revenue increased 85% and totaled $27.2 million compared to $14.7 million for the six months ended June 30, 2016, due to higher system sales and an increase in recurring revenue. Recurring revenue totaled $11.5 million, an increase of 44% compared to $8.0 million in the six months ended June 30, 2016. The growth in recurring revenue is attributed to the increase in the installed base and high utilization of the Company’s surgical guidance systems, both in the U.S. and globally. Gross margin for the six months ended June 30, 2017 was 67.3% compared with 75.7% in the six months ended June 30, 2016. This expected decrease is attributed mainly to the higher manufacturing costs of the Mazor X compared to the Renaissance system and the inclusion of six Renaissance trade-ins to Mazor X. Net loss for the six months ended June 30, 2017 was $8.9 million, or $0.19 per share, compared to a net loss of $9.2 million, or $0.21 per share, in the first six months of 2016.

SIX MONTHS ENDED JUNE 30, 2017 FINANCIAL RESULTS ON NON-GAAP BASIS

On a non-GAAP basis, the net loss for the first six months of 2017 was $6.3 million, or $0.13 per share, compared to a net loss of $8.1 million, or $0.19 per share, in the first six months of 2016.

CONFERENCE CALL INFORMATION

The Company will host a conference call to discuss its second quarter financial results as well as recent corporate developments on August 1, 2017 at 8:30 AM EDT (3:30 PM IDT). Investors within the United States interested in participating are invited to call 888-539-3679. Participants in Israel can use the toll-free dial-in number 1-80-924-6042. All other international participants can use the dial-in number 719-325-2322. For all callers, refer to Conference ID 8824893.

A replay of the event will be available for two weeks following the conclusion of the call. To access the replay, callers in the United States can call 1-866-375-1919 and reference the Replay Access Code: 8824893. All international callers can dial +1-719-457-0820, using the same Replay Access Code. To access the webcast, please visit www.mazorrobotics.com and select ‘Investor Relations.’

Use of Non-GAAP Measures

In addition to disclosing financial results calculated in accordance with generally accepted accounting principles in conformity with International Financial Reporting Standards (GAAP), this press release contains Non-GAAP financial measures for gross profit, operating expenses, operating loss, net loss and basic and diluted earnings per share that exclude the effects of capitalization of development costs, non-cash expense of amortization of intangible assets and share-based payments. Management believes that these non-GAAP financial measures provide meaningful supplemental information regarding the Company’s performance that enhances management’s and investors’ ability to evaluate the Company’s net income and earnings per share and to compare them to historical net income and earnings per share.

The presentation of this non-GAAP financial information is not intended to be considered in isolation or as a substitute for the financial information prepared and presented in accordance with GAAP. Management uses both GAAP and non-GAAP measures when operating and evaluating the Company’s business internally and therefore decided to make these non-GAAP adjustments available to investors.

About Mazor

Mazor Robotics (TASE: MZOR; NASDAQGM: MZOR) believes in healing through innovation by developing and introducing revolutionary technologies and products aimed at redefining the gold standard of quality care. Mazor Robotics Guidance System enables surgeons to conduct spine and brain procedures in an accurate and secure manner. For more information, please visit www.MazorRobotics.com.

Forward-Looking Statements

This press release contains forward-looking statements within the meaning of the Private Securities Litigation Reform Act of 1995 and other securities laws. Any statements in this release about future expectations, plans or prospects for the Company, including without limitation, statements regarding robust demand for the Company’s products, third quarter purchase orders, the amount of and timing of recording of additional revenue from backlog, and other statements containing the words “believes,” “anticipates,” “plans,” “expects,” “will” and similar expressions are forward-looking statements. These statements are only predictions based on Mazor’s current expectations and projections about future events. There are important factors that could cause Mazor’s actual results, level of activity, performance or achievements to differ materially from the results, level of activity, performance or achievements expressed or implied by the forward-looking statements. Those factors include, but are not limited to, the impact of general economic conditions, competitive products, product demand and market acceptance risks, reliance on key strategic alliances, fluctuations in operating results, and other factors indicated in Mazor’s filings with the Securities and Exchange Commission (SEC) including those discussed under the heading “Risk Factors” in Mazor’s annual report on Form 20-F filed with the SEC on May 1, 2017 and in subsequent filings with the SEC. For more details, refer to Mazor’s SEC filings. Mazor undertakes no obligation to update forward-looking statements to reflect subsequent occurring events or circumstances, or to changes in our expectations, except as may be required by law.

Mazor Robotics Ltd.
CONSOLIDATED STATEMENT OF PROFIT OR LOSS
(in thousands, except per share data)
(UNAUDITED)
Six month period Three month period
ended June 30, ended June 30,
2017 2016 2017 2016
Revenue $ 27,174 $ 14,703 $ 15,455 $ 8,284
Cost of revenue $ 8,875 $ 3,566 $ 4,726 $ 1,912
Gross profit $ 18,299 $ 11,137 $ 10,729 $ 6,372
Operating expenses:
Research and development, net $ 4,034 $ 3,242 $ 2,242 $ 1,111
Selling and marketing $ 20,209 $ 14,656 $ 10,316 $ 7,783
General and administrative $ 3,657 $ 2,412 $ 2,086 $ 1,429
Total operating cost and expenses $ 27,900 $ 20,310 $ 14,644 $ 10,323
Loss from operations $ (9,601) $ (9,173) $ (3,915) $ (3,951)
Financing income, net $ 443 $ 203 $ 232 $ 28
Loss before taxes on income $ (9,158) $ (8,970) $ (3,683) $ (3,923)
Income tax expense (benefit) $ (250) $ 209 $ (7) $ 144
Net loss $ (8,908) $ (9,179) $ (3,676) $ (4,067)
Net loss per share – Basic and diluted $ (0.19) $ (0.21) $ (0.08) $ (0.09)
Weighted average common shares outstanding – Basic and diluted 47,990 42,880 48,227 43,347
Mazor Robotics Ltd.
CONSOLIDATED STATEMENTS OF FINANCIAL POSITION AS OF
(U.S. Dollars in thousands)
June 30, December 31,
2017 2016
(Unaudited) (Audited)
Current assets
Cash and cash equivalents $ 20,347 $ 14,954
Short-term investments 33,267 37,862
Trade receivables 6,298 8,225
Other current assets 2,411 1,728
Inventory 7,365 4,715
Total current assets 69,688 67,484
Non-current assets
Long-term investments 3,800 9,017
Property and equipment, net 4,168 3,615
Intangible assets, net 2,093 2,258
Other non-current assets 981 351
Total non-current assets 11,042 15,241
Total assets $ 80,730 $ 82,725
Current liabilities
Trade payables $ 2,526 $ 5,018
Deferred revenue 3,481 4,031
Other current liabilities 11,772 8,462
Total current liabilities 17,779 17,511
Non-current liabilities
Employee benefits 461 325
Total non-current liabilities 461 325
Total liabilities 18,240 17,836
Equity
Share capital 126 124
Share premium 180,318 174,647
Capital reserve for share-based payment transactions 10,695 9,859
Foreign currency translation reserve 2,119 2,119
Accumulated loss (130,768) (121,860)
Total equity 62,490 64,889
Total liabilities and equity $ 80,730 $ 82,725
Mazor Robotics Ltd.
CONSOLIDATED CASH FLOW STATEMENTS
(U.S. Dollars in thousands)
(UNAUDITED)
Six months ended Three months ended
June 30, June 30,
2017 2016 2017

2016

Cash flows from operating activities:
Loss for the period $ (8,908) $ (9,179) $ (3,676) $ (4,067)
Adjustments:
Depreciation and amortization $ 714 $ 296 $ 372 $ 150
Finance income, net $ (119) $ (173) $ (69) $ (31)
Share-based payments $ 2,422 $ 2,134 $ 1,221 $ 1,218
Income tax expense (tax benefit) $ (250) $ 209 $ (7) $ 144
$ 2,767 $ 2,466 $ 1,517 $ 1,481
Change in inventory $ (2,950) $ (635) $ (1,588) $ (610)
Change in trade and other accounts receivable $ 1,260 $ 2,377 $ (3,511) $ 639
Change in prepaid lease fees $ (22) $ (4) $ (1) $ 6
Change in trade and other accounts payable $ 792 $ 1,333 $ (311) $ 1,869
Change in employee benefits $ 136 $ 68 $ 58 $ (8)
$ (784) $ 3,139 $ (5,353) $ 1,896
Interest received $ 183 $ 137 $ 111 $ 73
Income tax paid $ (15) $ (39) $ (15) $ (2)
$ 168 $ 98 $ 96 $ 71
Net cash used in operating activities $ 6,757 $ 3,476 $ 7,416 $ 619
Cash flows from investing activities:
Proceeds from (investment in) short-term investments and deposits, net $ 10,435 $ (2,377) $ 1,478 $ (9,023)
Investment in long-term investments $ (623) $ (1,125) $ (525) $ (629)
Purchase of property and equipment $ (1,313) $ (1,203) $ (504) $ (785)
Capitalization of development costs $ $ (597) $ $ (597)
Net cash provided by (used in) investing activities $ 8,499 $ (5,302) $ 449 $ (11,034)
Cash flows from financing activities:
Proceeds from issuance of ADRs, net $ $ 11,895 $ $ 11,895
Proceeds from exercise of share options by employees $ 3,719 $ 123 $ 1,460 $ 48
Proceeds from exercise of share options and warrants, net $ $ 481 $ $
Net cash provided by financing activities $ 3,719 $ 12,499 $ 1,460 $ 11,943
Net increase (decrease) in cash and cash equivalents $ 5,461 $ 3,721 $ (5,507) $ 290
Cash and cash equivalents at the beginning of the period $ 14,954 $ 13,519 $ 25,896 $ 17,008
Effect of exchange rate differences on balances of cash and cash equivalents $ (68) $ 37 $ (42) $ (21)
Cash and cash equivalents at the end of the period $ 20,347 $ 17,277 $ 20,347 $ 17,277
Supplementary cash flows information:
Purchase of property and equipment in credit $ (55) $ (32) $ (55) $ (32)
Issuance costs in credit $ $ (199) $ $ (199)
Capitalization of development expenses on credit $ $ (414) $ $ (414)
Classification of inventory to fixed assets $ 300 $ $ 164 $
Mazor Robotics Ltd.
RECONCILIATIONS OF GAAP TO NON-GAAP FINANCIAL MEASURES
(U.S. Dollars in thousands, except per share data)
(UNAUDITED)
Six month period Three month period
ended June 30, ended June 30,
2017 2016 2017 2016
GAAP gross profit $ 18,299 $ 11,137 $ 10,729 $ 6,372
Amortization of intangible assets 165 83
Share-based payments 108 83 55 47
Non-GAAP gross profit $ 18,572 $ 11,220 $ 10,867 $ 6,419
GAAP gross profit as percentage of revenues 67.3% 75.7% 69.4% 76.9%
Non-GAAP gross profit as percentage of revenues 68.3% 76.3% 70.3% 77.5%
GAAP operating expenses $ 27,900 $ 20,310 $ 14,644 $ 10,323
Share-based payments:
Research and development $ 352 $ 347 $ 194 $ 197
Selling and marketing $ 851 $ 1,215 $ 411 $ 695
General and administrative $ 1,111 $ 489 $ 561 $ 279
Development costs capitalization $ $ (1,011) $ $ (1,011)
Non-GAAP operating expenses $ 25,586 $ 19,270 $ 13,478 $ 10,163
GAAP operating loss $ (9,601) $ (9,173) $ (3,915) $ (3,951)
Non-GAAP operating loss $ (7,014) $ (8,050) $ (2,611) $ (3,744)
GAAP net loss $ (8,908) $ (9,179) $ (3,676) $ (4,067)
Amortization of intangible assets $ 165 $ $ 83 $
Share-based payments $ 2,422 $ 2,134 $ 1,221 $ 1,218
Development costs capitalization $ $ (1,011) $ $ (1,011)
Non-GAAP net loss $ (6,321) $ (8,056) $ (2,372) $ (3,860)
GAAP basic and diluted loss per share $ (0.19) $ (0.21) $ (0.08) $ (0.09)
Non-GAAP basic and diluted loss per share $ (0.13) $ (0.19) $ (0.05) $ (0.09)

stryker-headquarters.jpg

July 31, 2017 OrthoSpineNews

By GlobeNewswire,  July 27, 2017

Kalamazoo, Michigan – July 27, 2017 – Stryker Corporation (NYSE:SYK) reported operating results for the second quarter of 2017:

Second Quarter Highlights

Net sales grew 6.1% to $3.0 billion (6.9% constant currency)

Orthopaedics 5.5 % or 6.5% constant currency
MedSurg 6.2 % or 6.8% constant currency
Neurotechnology and Spine 6.9 % or 7.9% constant currency

Adjusted net earnings per diluted share(1) increased 10.1% to $1.53

Reported net earnings per diluted share increased 3.0% to $1.03

“Our growth momentum continued in the second quarter as we continue to drive share gains through new products and strong commercial execution,” said Kevin A. Lobo, Chairman and Chief Executive Officer. “We are raising our full year guidance for both organic sales growth and EPS, which reflects our expectations for continued strong performance throughout the year.”

Sales Analysis

Consolidated net sales of $3.0 billion increased 6.1% in the quarter as reported and 6.9% in constant currency, as foreign currency exchange rates negatively impacted net sales by 0.8%. Excluding the 0.2% impact of acquisitions, net sales in the quarter increased 6.7% in constant currency, including 8.2% from increased unit volume partially offset by 1.5% due to lower prices.

Orthopaedics net sales of $1.1 billion increased 5.5% in the quarter as reported and 6.5% in constant currency, as foreign currency exchange rates negatively impacted net sales by 1.0%. Excluding the 0.3% impact of acquisitions, net sales in the quarter increased 6.2% in constant currency, including 8.6% from increased unit volume partially offset by 2.4% due to lower prices.

MedSurg net sales of $1.3 billion increased 6.2% in the quarter as reported and 6.8% in constant currency, as foreign currency exchange rates negatively impacted net sales by 0.6%. Excluding the 0.1% impact of acquisitions, net sales in the quarter increased 6.7% in constant currency, including 7.1% from increased unit volume partially offset by 0.4% due to lower prices.

Neurotechnology and Spine net sales of $0.5 billion increased 6.9% in the quarter as reported and 7.9% in constant currency, as foreign currency exchange rates negatively impacted net sales by 1.0%. Net sales in the quarter increased 10.0% from increased unit volume partially offset by 2.1% due to lower prices.

Earnings Analysis

Reported net earnings of $391 million increased 2.9% in the quarter. Reported net earnings per diluted share of $1.03 increased 3.0% in the quarter. Reported net earnings include certain charges for the amortization of purchased intangible assets, Rejuvenate and ABG II and other recall matters, restructuring-related activities, legal matters and acquisition and integration related activities. The effect of each of these matters on reported net earnings and net earnings per diluted share appears in the reconciliation of actual results to adjusted results below. Excluding the impact of these charges increases gross profit margin in the quarter from 66.1% to 66.3% and increases operating income margin from 16.6% to 25.0%. Excluding the impact of the items described above, adjusted net earnings(2) of $581 million increased 10.7% in the quarter. Adjusted net earnings per diluted share(1) of $1.53 increased 10.1% in the quarter.

2017 Outlook

We now expect 2017 organic net sales growth to be in the range of 6.5% to 7.0% and adjusted net earnings per diluted share(3) to be in the range of $6.45 to $6.55. For the third quarter we expect adjusted net earnings per diluted share(3) to be in the range of $1.50 to $1.55. If foreign currency exchange rates hold near current levels, we expect net sales in the third quarter and full year to be negatively impacted by approximately 0.5% and adjusted net earnings per diluted share to be negatively impacted by approximately $0.02 in the third quarter and $0.10 in the full year.

(1) A reconciliation of reported net earnings per diluted share to adjusted net earnings per diluted share, a non-GAAP financial measure, and other important information appears below.

(2) A reconciliation of reported net earnings to adjusted net earnings, a non-GAAP financial measure, and other important information appears below.

(3) A reconciliation of expected net earnings per diluted share to expected adjusted net earnings per diluted share for the third quarter and full year and other important information appears below.

Conference Call on Thursday, July 27, 2017

As previously announced, the Company will host a conference call on Thursday, July 27, 2017 at 4:30 p.m., Eastern Time, to discuss the Company’s operating results for the quarter ended June 30, 2017 and provide an operational update.

To participate in the conference call dial (844) 826-0610 (domestic) or (973) 453-3249 (international) and be prepared to provide conference ID number 26061645 to the operator.

A simultaneous webcast of the call will be accessible via the Company’s website at www.stryker.com. The call will be archived on the Investors page of this site.

A recording of the call will also be available from 8:00 p.m., Eastern Time, on Thursday, July 27, 2017, until 11:59 p.m., Eastern Time, on Thursday, August 3, 2017. To hear this recording, you may dial (855) 859-2056 (domestic) or (404) 537-3406 (international) and enter conference ID number 26061645.

Caution Concerning Forward-Looking Statements

This press release contains information that includes or is based on forward-looking statements within the meaning of the federal securities laws that are subject to various risks and uncertainties that could cause our actual results to differ materially from those expressed or implied in such statements. Such factors include, but are not limited to: weakening of economic conditions that could adversely affect the level of demand for our products; pricing pressures generally, including cost-containment measures that could adversely affect the price of or demand for our products; changes in foreign exchange markets; legislative and regulatory actions; unanticipated issues arising in connection with clinical studies and otherwise that affect U.S. Food and Drug Administration approval of new products; potential supply disruptions; changes in reimbursement levels from third-party payors; a significant increase in product liability claims; the ultimate total cost with respect to the Rejuvenate and ABG II matter; the impact of investigative and legal proceedings and compliance risks; resolution of tax audits; the impact of the federal legislation to reform the United States healthcare system; changes in financial markets; changes in the competitive environment; our ability to integrate acquisitions; and our ability to realize anticipated cost savings. Additional information concerning these and other factors is contained in our filings with the U.S. Securities and Exchange Commission, including our Annual Report on Form 10-K and Quarterly Reports on Form 10-Q.

Stryker is one of the world’s leading medical technology companies and, together with our customers, we are driven to make healthcare better. The Company offers a diverse array of innovative products and services in Orthopaedics, Medical and Surgical, and Neurotechnology and Spine that help improve patient and hospital outcomes. Stryker is active in over 100 countries around the world. Please contact us for more information at www.stryker.com.

For investor inquiries please contact:

Katherine A. Owen, Stryker Corporation, 269-385-2600 or katherine.owen@stryker.com

For media inquiries please contact:

Yin Becker, Stryker Corporation, 269-385-2600 or yin.becker@stryker.com


STRYKER CORPORATION

For the Three and Six Months June 30

(Unaudited – Millions of Dollars, Except Per Share Amounts)

CONDENSED STATEMENTS OF EARNINGS

Three Months Six Months
2017 2016 % Change 2017 2016 % Change
Net sales $ 3,012 $ 2,840 6.1 % $ 5,967 $ 5,335 11.8 %
Cost of sales 1,022 998 2.4 2,015 1,799 12.0
Gross profit $ 1,990 $ 1,842 8.0 % $ 3,952 $ 3,536 11.8 %
% of sales 66.1 % 64.9 % 66.2 % 66.3 %
Research, development and engineering expenses 192 183 4.9 384 342 12.3
Selling, general and administrative expenses 1,130 1,043 8.3 2,232 1,987 12.3
Recall charges 72 28 157.1 98 47 108.5
Amortization of intangible assets 95 88 8.0 183 141 29.8
Total operating expenses $ 1,489 $ 1,342 11.0 % $ 2,897 $ 2,517 15.1 %
Operating income $ 501 $ 500 0.2 % $ 1,055 $ 1,019 3.5 %
% of sales 16.6 % 17.6 % 17.7 % 19.1 %
Other income (expense), net (57 ) (67 ) (14.9 ) (112 ) (105 ) 6.7
Earnings before income taxes $ 444 $ 433 2.5 % $ 943 $ 914 3.2 %
Income taxes 53 53 108 132 (18.2 )
Net earnings $ 391 $ 380 2.9 % $ 835 $ 782 6.8 %
Net earnings per share of common stock:
Basic $ 1.04 $ 1.02 2.0 % $ 2.23 $ 2.09 6.7 %
Diluted $ 1.03 $ 1.00 3.0 % $ 2.20 $ 2.07 6.3 %
Weighted-average shares outstanding – in millions:
Basic 373.9 374.2 373.7 373.7
Diluted 379.8 378.5 379.6 378.0


CONDENSED BALANCE SHEETS
June December
2017 2016
Assets
Cash and cash equivalents $ 3,649 $ 3,316
Marketable securities 98 68
Accounts receivable, net 1,905 1,967
Inventories 2,279 2,030
Other current assets 547 480
Total current assets $ 8,478 $ 7,861
Property, plant and equipment, net 1,758 1,569
Goodwill and other intangibles, net 9,853 9,864
Other noncurrent assets 1,203 1,141
Total assets $ 21,292 $ 20,435
Liabilities and shareholders’ equity
Current liabilities $ 3,014 $ 2,554
Accrued recall expenses 538 594
Other noncurrent liabilities 1,113 1,051
Long-term debt, excluding current maturities 6,592 6,686
Shareholders’ equity 10,035 9,550
Total liabilities and shareholders’ equity $ 21,292 $ 20,435


CONDENSED STATEMENTS OF CASH FLOWS
Six Months
2017 2016
Operating activities
Net earnings $ 835 $ 782
Depreciation 127 106
Amortization of intangible assets 183 141
Changes in operating assets and liabilities and other, net (344 ) (274 )
Net cash provided by operating activities $ 801 $ 755
Investing activities
Acquisitions, net of cash acquired $ (38 ) $ (4,219 )
Change in marketable securities, net (30 ) 536
Purchases of property, plant and equipment (270 ) (229 )
Net cash used in investing activities $ (338 ) $ (3,912 )
Financing activities
Borrowings/repayments of debt, net $ 443 $ 3,611
Dividends paid (318 ) (284 )
Repurchases of common stock (230 ) (13 )
Other financing (72 ) (56 )
Net cash (used in) provided by financing activities $ (177 ) $ 3,258
Effect of exchange rate changes on cash and cash equivalents 47 10
Change in cash and cash equivalents $ 333 $ 111


STRYKER CORPORATION

For the Three and Six Months Ended June 30

(Unaudited – Millions of Dollars)

CONDENSED SALES ANALYSIS

Three Months Six Months
Percentage Change Percentage Change
2017 2016 As Reported Constant

Currency

2017 2016 As Reported Constant

Currency

Geographic:
United States $ 2,201 $ 2,050 7.4 % 7.4 % $ 4,364 $ 3,871 12.7 % 12.7 %
International 811 790 2.7 5.7 1,603 1,464 9.5 11.9
Total $ 3,012 $ 2,840 6.1 % 6.9 % $ 5,967 $ 5,335 11.8 % 12.5 %
Segment:
Orthopaedics $ 1,141 $ 1,082 5.5 % 6.5 % $ 2,276 $ 2,139 6.4 % 7.2 %
MedSurg 1,336 1,258 6.2 6.8 2,641 2,216 19.2 19.7
Neurotechnology and Spine 535 500 6.9 7.9 1,050 980 7.1 7.8
Total $ 3,012 $ 2,840 6.1 % 6.9 % $ 5,967 $ 5,335 11.8 % 12.5 %


SUPPLEMENTAL SALES GROWTH ANALYSIS
Three Months
Percentage Change
United States International
2017 2016 As Reported Constant Currency As Reported As Reported Constant Currency
Orthopaedics:
Knees $ 389 $ 370 5.0 % 5.9 % 7.0 % 0.1 % 3.0 %
Hips 322 323 (0.3 ) 1.0 2.1 (4.3 ) (0.8 )
Trauma and Extremities 351 328 7.0 8.0 11.4 (0.5 ) 2.4
Other 79 61 32.0 32.1 34.8 20.1 20.9
Total Orthopaedics $ 1,141 $ 1,082 5.5 % 6.5 % 8.8 % (1.0 )% 2.1 %
MedSurg:
Instruments $ 392 $ 377 4.1 % 4.7 % 4.2 % 3.6 % 6.2 %
Endoscopy 406 357 13.9 14.3 15.5 8.4 10.2
Medical 474 465 1.6 2.4 2.3 (0.7 ) 2.8
Sustainability 64 59 10.0 10.0 10.0 8.4 13.0
Total MedSurg $ 1,336 $ 1,258 6.2 % 6.8 % 7.0 % 3.4 % 6.2 %
Neurotechnology and Spine:
Neurotechnology $ 352 $ 312 12.8 % 13.9 % 10.3 % 17.3 % 20.4 %
Spine 183 188 (2.9 ) (2.1 ) (1.3 ) (7.7 ) (4.7 )
Total Neurotechnology and Spine $ 535 $ 500 6.9 % 7.9 % 5.5 % 10.0 % 13.1 %
Total $ 3,012 $ 2,840 6.1 % 6.9 % 7.4 % 2.7 % 5.7 %


Six Months
Percentage Change
United States International
2017 2016 As Reported Constant Currency As Reported As Reported Constant Currency
Orthopaedics:
Knees $ 780 $ 731 6.8 % 7.3 % 7.2 % 5.5 % 7.4 %
Hips 642 639 0.4 1.5 2.1 (2.2 ) 0.6
Trauma and Extremities 703 655 7.3 8.1 10.7 1.5 4.0
Other 151 114 33.0 33.0 30.5 45.2 44.6
Total Orthopaedics $ 2,276 $ 2,139 6.4 % 7.2 % 8.3 % 2.6 % 4.9 %
MedSurg:
Instruments $ 786 $ 742 5.9 % 6.4 % 6.0 % 5.7 % 8.0 %
Endoscopy 779 685 13.8 14.0 15.0 9.4 10.7
Medical 949 672 41.2 42.3 38.9 49.8 55.2
Sustainability 127 117 8.8 8.8 8.7 27.0 28.2
Total MedSurg $ 2,641 $ 2,216 19.2 % 19.7 % 18.9 % 20.3 % 22.9 %
Neurotechnology and Spine:
Neurotechnology $ 683 $ 613 11.3 % 12.0 % 10.0 % 13.7 % 15.6 %
Spine 367 367 0.1 0.6 0.5 (1.3 ) 1.1
Total Neurotechnology and Spine $ 1,050 $ 980 7.1 % 7.8 % 6.1 % 9.4 % 11.5 %
Total $ 5,967 $ 5,335 11.8 % 12.5 % 12.7 % 9.5 % 11.9 %

NON-GAAP FINANCIAL MEASURES

We supplement the reporting of our financial information determined under accounting principles generally accepted in the United States (GAAP) with certain non-GAAP financial measures, including percentage sales growth in constant currency; percentage organic sales growth; adjusted gross profit; cost of sales excluding specified items; adjusted selling, general and administrative expenses; adjusted operating income; adjusted effective income tax rate; adjusted net earnings; and adjusted net earnings per diluted share. We believe that these non-GAAP measures provide meaningful information to assist shareholders in understanding our financial results and assessing our prospects for future performance. Management believes percentage sales growth in constant currency and the other adjusted measures described above are important indicators of our operations because they exclude items that may not be indicative of or are unrelated to our core operating results and provide a baseline for analyzing trends in our underlying businesses. Management uses these non-GAAP financial measures for reviewing the operating results of reportable business segments and analyzing potential future business trends in connection with our budget process and bases certain management incentive compensation on these non-GAAP financial measures.

To measure percentage sales growth in constant currency, we remove the impact of changes in foreign currency exchange rates that affect the comparability and trend of sales. Percentage sales growth in constant currency is calculated by translating current and prior year results at the same foreign currency exchange rate. To measure percentage organic sales growth, we remove the impact of changes in foreign currency exchange rates and acquisitions that affect the comparability and trend of sales. Percentage organic sales growth is calculated by translating current and prior year results at the same foreign currency exchange rate excluding the impact of acquisitions. To measure earnings performance on a consistent and comparable basis, we exclude certain items that affect the comparability of operating results and the trend of earnings.

Because non-GAAP financial measures are not standardized, it may not be possible to compare these financial measures with other companies’ non-GAAP financial measures having the same or similar names. These adjusted financial measures should not be considered in isolation or as a substitute for reported sales growth, gross profit, selling, general and administrative expenses, operating income, effective income tax rate, net earnings and net earnings per diluted share, the most directly comparable GAAP financial measures. These non-GAAP financial measures are an additional way of viewing aspects of our operations when viewed with our GAAP results and the reconciliations to corresponding GAAP financial measures below. We strongly encourage investors and shareholders to review our financial statements and publicly-filed reports in their entirety and not to rely on any single financial measure. The following reconciles the non-GAAP financial measures discussed above with the most directly comparable GAAP financial measures:

STRYKER CORPORATION

For the Three Months and Six Months June 30

(Unaudited – Millions of Dollars, Except Per Share Amounts)

Reconciliation of Non-GAAP Financial Measures to the Most Directly Comparable GAAP Financial Measures

Three Months 2017 Gross Profit Selling, General & Administrative Expenses Amortization of Intangible Assets Operating Income Net Earnings Effective

Tax Rate

Diluted EPS
Reported $ 1,990 $ 1,130 $ 95 $ 501 $ 391 11.8 % $ 1.03
Acquisition and integration related charges: (a)
Inventory stepped-up to fair value 1 1 0.1
Other acquisition and integration related (8 ) 8 7 0.02
Amortization of purchased intangible assets (95 ) 95 63 3.7 0.16
Restructuring-related charges (b) 6 (39 ) 45 41 (0.6 ) 0.11
Rejuvenate and other recall matters (c) 72 54 1.3 0.14
Legal matters (d) (30 ) 30 25 0.07
Adjusted $ 1,997 $ 1,053 $ $ 752 $ 581 16.3 % $ 1.53


Three Months 2016 Gross Profit Selling, General & Administrative Expenses Amortization of Intangible Assets Operating Income Net Earnings Effective

Tax Rate

Diluted EPS
Reported $ 1,842 $ 1,043 $ 88 $ 500 $ 380 12.3 % $ 1.00
Acquisition and integration related charges: (a)
Inventory stepped-up to fair value 35 35 22 1.6 0.06
Other acquisition and integration related (31 ) 31 21 1.0 0.06
Amortization of purchased intangible assets (88 ) 88 59 3.1 0.16
Restructuring-related charges (b) 2 (20 ) 22 20 (0.4 ) 0.05
Rejuvenate and other recall matters (c) 28 23 0.06
Adjusted $ 1,879 $ 992 $ $ 704 $ 525 17.6 % $ 1.39


Six Months 2017 Gross Profit Selling, General & Administrative Expenses Amortization of Intangible Assets Operating Income Net Earnings Effective

Tax Rate

Diluted EPS
Reported $ 3,952 $ 2,232 $ 183 $ 1,055 $ 835 11.4 % $ 2.20
Acquisition and integration related charges: (a)
Other acquisition and integration related (18 ) 18 14 0.2 0.04
Amortization of purchased intangible assets (183 ) 183 124 3.1 0.32
Restructuring-related charges (b) 11 (72 ) 83 68 0.2 0.18
Rejuvenate and other recall matters (c) 98 75 0.9 0.20
Legal matters (d) (30 ) 30 25 0.07
Adjusted $ 3,963 $ 2,112 $ $ 1,467 $ 1,141 15.8 % $ 3.01


Six Months 2016 Gross Profit Selling, General & Administrative Expenses Amortization of Intangible Assets Operating Income Net Earnings Effective

Tax Rate

Diluted EPS
Reported $ 3,536 $ 1,987 $ 141 $ 1,019 $ 782 14.5 % $ 2.07
Acquisition and integration related charges: (a)
Inventory stepped-up to fair value 35 35 22 0.7 0.06
Other acquisition and integration related (36 ) 36 25 0.5 0.07
Amortization of purchased intangible assets (141 ) 141 98 2.0 0.26
Restructuring-related charges (b) 5 (37 ) 42 34 0.1 0.09
Rejuvenate and other recall matters (c) 47 39 0.10
Legal matters (d) 12 (12 ) (7 ) (0.3 ) (0.02 )
Adjusted $ 3,576 $ 1,926 $ $ 1,308 $ 993 17.5 % $ 2.63


(a) Charges represent certain acquisition and integration related costs associated with acquisitions.
(b) Charges represent the cost associated with certain restructuring-related charges associated with workforce reductions and other restructuring-related activities.
(c) Charges represent changes in our best estimate of the minimum end of the range of probable loss to resolve the Rejuvenate recall and other recall matters.
(d) Amount represents gains or losses associated with legal settlements.


STRYKER CORPORATION

For the Three Months September 30, 2017 and Full Year December 31, 2017

Reconciliation of Expected Net Earnings Per Diluted Share to Expected Adjusted Net Earnings per Diluted Share

Three Months Full Year
Low High Low High
Expected – Reported $ 1.15 $ 1.28 $ 5.05 $ 5.25
Acquisition and integration related charges 0.05 0.02 0.13 0.08
Amortization of purchased intangible assets 0.15 0.15 0.65 0.65
Restructuring-related charges 0.15 0.10 0.35 0.30
Rejuvenate and other recall matters 0.20 0.20
Legal matters 0.07 0.07
Expected – Adjusted $ 1.50 $ 1.55 $ 6.45 $ 6.55


This announcement is distributed by Nasdaq Corporate Solutions on behalf of Nasdaq Corporate Solutions clients.

The issuer of this announcement warrants that they are solely responsible for the content, accuracy and originality of the information contained therein.

Source: Stryker Corporation via Globenewswire


For-PR-691x550-1.jpg

July 31, 2017 OrthoSpineNews

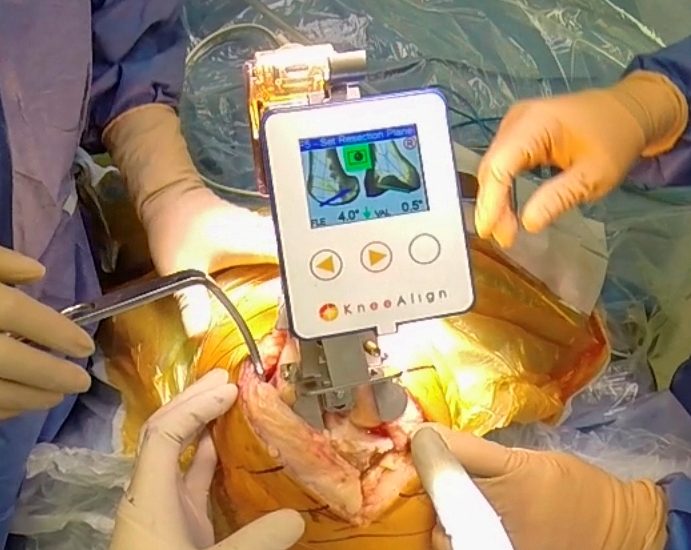
OrthAlign, Inc., a privately held U.S.-based medical device and technology company providing orthopedic surgeons with advanced precision technologies, announced today a distribution partnership with Ortosistemas S.A. and the first set of KneeAlign® cases successfully completed for total knee arthroplasty (TKA) in the country of Panama.

These cases were completed by Panama City-based orthopaedic surgeon Edmundo Ford, MD of Centro de Especialidades Ortopedicas at Hospital San Fernando and continue to demonstrate the rapid adoption of OrthAlign’s handheld precision technologies, by surgeons throughout the world (the technology is now utilized in over 45 countries).

“KneeAlign is easy, simple, and reliable,” said Dr. Ford. “I’m happy to know that going forward, my total knees no longer are subject to human error. Our patients will be happy to know that their knees are being treated with a technology that helps to achieve the best alignment possible, in order to maximize implant survival and a superior outcome.”

OrthAlign provides highly accurate, computer-assisted, handheld technologies for surgeons to receive real-time, actionable data for precise alignment and positioning of components in total knee, unicondylar knee, and total hip (both posterior and anterior) arthroplasty surgeries. Over 15 peer-reviewed clinical studies have been published to date, validating OrthAlign’s accuracy, simplicity of use, and benefits in recovery for the patient.

Maria Luisa Muñoz, Chief Executive Officer of Ortosistemas S.A., a market leading orthopaedic distributor in Panama for over 25 years, stated, “Technology is a very important part of Panama’s growing joint arthroplasty market. Surgeons are looking for tools to provide their patients with better outcomes. We are pleased to be OrthAlign’s partner in Panama and look forward to not only providing surgeons with this valuable tool, but also further expanding our market share.”

“Panama is the gateway for our expansion into Latin America,” said James Young Kim, OrthAlign’s Vice President and General Manager of International. “Over the next few years, Latin America is expected to be a major driver in global market growth, however, high costs of surgery are making it difficult for surgeons to even use technologies that will help them be more accurate. OrthAlign’s cost-effective, highly accurate technology is the answer for the Latin American market.”

About OrthAlign, Inc.

OrthAlign is a privately held medical device and technology company, developing advanced technologies that deliver healthier and more pain-free lifestyles to joint replacement patients, globally. We provide healthcare professionals with cutting edge, computer-assisted surgical tools that seamlessly and cost-effectively deliver vital data and clinical results to optimize outcomes for our patients. For more information regarding OrthAlign, please visit http://www.orthalign.com.

“ORTHALIGN®, ORTHALIGN PLUS®, KNEEALIGN®, KNEEALIGN® 2, HIPALIGN®, and UNIALIGN™ are registered trademarks of OrthAlign, Inc.”


1-1-2.jpeg

July 31, 2017 OrthoSpineNews

TORONTOJuly 31, 2017 /PRNewswire/ — 7D Surgical, developer of ground breaking surgical navigation technologies, announced today that Spartan Medical has purchased the 7D Surgical System to support its strategic sales plan in MarylandWashington D.C. and Virginia.  7D Surgical has entered into an exclusive sales representative agreement with Spartan Medical for many of the premier medical facilities within those markets.

“Our new partnership with Spartan Medical is another important step in our rapid growth strategy in North America,” said Beau Standish, Chief Executive Officer of 7D Surgical.  “Their expertise and unique relationships with federal facilities will be critical in bringing the most advanced machine-vision based navigation technologies to DoD spine surgeons and the U.S. military personnel and veterans they serve.”

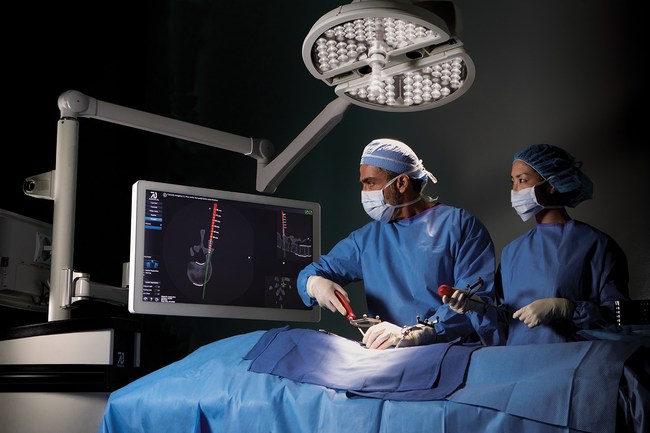
The 7D Surgical System is the first and only Machine-Vision Image Guided Surgery (MvIGS) platform. For the first-time spine surgery patients can be automatically registered using only visible light in just seconds with 7D Surgical’s Flash™ Registration technology. Unlike time-consuming conventional image guided surgery (IGS) systems that depend on intraoperative radiation, this new MvIGS platform can achieve an incredibly fast surgical workflow for spine procedures.  Continuing to leverage the capabilities of machine-vision, 7D Surgical’s soon to be released Flash™ Fix technology can also update and correct the registration at any time during the procedure in just seconds.

“To me, this is similar to the invention of the X-ray,” said Vince Proffitt, President of Spartan Medical.  “Those of us that have been in surgeries supporting our implants know the real challenges of accurate and reproducible imaging and navigation.  We know how dependent the surgery may be on the equipment technicians’ skills and training, and we also know the incredible risks of daily radiation. The 7D Surgical System eliminates these critical concerns and creates a surgeon controlled, real-time, radiation-free, simple and accurate imaging and navigation system…truly a technological marvel!”

Live demonstrations of the 7D Surgical System are available at Spartan Medical Headquarters in Silver Spring, Maryland.  Contact Spartan Medical to schedule a time to experience the system in action at 1-888-240-8091, or email Spartan Medical at 170185@email4pr.com.

About 7D Surgical
7D Surgical is a privately-owned Toronto based company that develops advanced optical technologies and machine vision-based registration algorithms to improve surgical workflow and patient care. 7D Surgical’s flagship FDA 510(k)-cleared and Health Canada-approved MvIGS system delivers profound improvement to surgical workflows in spine surgery, providing the promise of similar future advancements in other surgical specialties.  www.7Dsurgical.com

Flash™ Fix: http://7dsurgical.com/7d-surgical-system/flash-technology/

Contact:
Beau Standish, CEO
7D Surgical
+1 647 484-0078
www.7Dsurgical.com
170185@email4pr.com

About Spartan Medical

Spartan Medical Inc. was founded in 2008 by a former Air Force Intelligence Officer to provide an extensive armamentarium of advanced medical devices and technologies focused on the needs of the VA and DoD surgeon.  Spartan Medical is considered a top priority vendor in the VA as a certified Service-Disabled Veteran-Owned Small Business (SDVOSB), and has secured multi-year Blanket Purchase Agreements at 30 major military treatment facilities.  With a core staff possessing over 200 years of combined expertise and experience in the field, and numerous highly trained and skilled consultants across the nation, Spartan Medical assures no single points of failure.  Consistent with its mission to provide the best products and services to our nation’s wounded warriors and veterans, Spartan Medical has recently collaborated with 7D Surgical to provide the most innovative, state-of-the-art, image-guided spinal navigation system – with zero radiation –  to meet the incredible need to improve implant placement accuracy in real-time while eliminating radiation in the operating room.

Contact:
Vince Proffitt, President
Spartan Medical Inc.
+1 888 240 -8091
www.spartanmedspine.com
170185@email4pr.com

Forward-looking Statements

This press release contains forward-looking statements regarding, among other things, statements pertaining to expectations, goals, plans, objectives, and future events. 7D Surgical intends such forward-looking statements to be covered by the safe harbor provisions for forward-looking statements contained in Section 21E of the Securities Exchange Act of 1934, and the Private Securities Reform Act of 1995. In some cases, forward-looking statements can be identified by the following words: “may,” “can,” “will,” “could,” “would,” “should,” “expect,” “intend,” “plan,” “anticipate,” “believe,” “estimate,” “predict,” “project,” “potential,” “promise,” “continue,” “ongoing,” or the negative of these terms or other comparable terminology, although not all forward-looking statements contain these words. These statements are based on the current estimates and assumptions of our management as of the date of this press release and are subject to risks, uncertainties, changes in circumstances, assumptions, and other factors that may cause actual results to differ materially from those indicated by forward-looking statements, many of which are beyond 7D Surgical’s ability to control or predict. Given these uncertainties, undue reliance should not be placed on these forward-looking statements. 7D Surgical does not undertake any obligation to release publicly any updates or revisions to these forward-looking statements to reflect events or circumstances after the date of this press release or to reflect the occurrence of unanticipated events.

“Flash,” as well as the “7D” logo, whether standing alone or in connection with the words “7D Surgical” are protected trademarks of 7D Surgical.

SOURCE 7D Surgical Inc.

Related Links

http://7dsurgical.com


b7cd4bac4d62ecbb662a19c80fac1122-1000x550.png

July 28, 2017 OrthoSpineNews

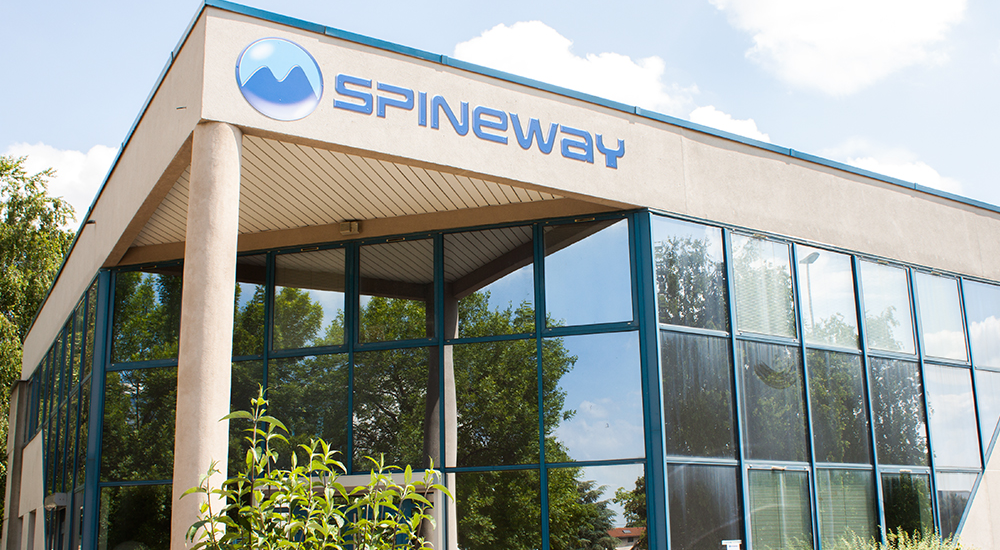
Spineway, specialist in surgical implants and instruments for treating disorders of the spinal column (spine), announces that it is setting up an issue of Tranche Warrants for Notes with Warrants to finance the acceleration of its development.

Legal framework

In accordance with the delegation of power granted to the Board of Directors and approved by the Ordinary and Extraordinary General Meeting of Spineway (the “Company“) shareholders held on June 19, 2017, Spineway’s Board of Directors approved – on July 20, 2017 – the plan for an issue of 200 warrants (the “Tranche Warrants“), the exercise of which gives access to the issue of 200 notes redeemable in cash and/or convertible into new and/or existing shares (the “Notes“) with warrants to subscribe shares (the “Warrants“), representing  a bond issue in the amount of €2M in favor of the YA II PN, LTD investment fund (the “Investor“), a fund managed by the US management company Yorkville Advisors, and empowered the CEO to decide to launch this transaction, approve its final terms and conditions, and issue the Tranche Warrants.

Pursuant to an issuance agreement entered into today between the Investor and Spineway, the Investor has agreed to subscribe – during a period of 36 months as from the date of issue of the Tranche Warrants – up to 200 Notes with Warrants, representing a total par value of €2M, in several successive tranches (each referred to as a “Tranche“), which investor is not, however, intended to remain as Spineway capital in the long term.

This issuance is subject to the transfer of the Spineway shares to the “Public Offering” compartment of Euronext Growth and obtaining prior approval from the Autorité des Marchés Financiers of the prospectus to be prepared by the Company by December 31, 2017, at the latest. Therefore, if this condition precedent is met, the issuance of the Tranche Warrants and subscription for the first Tranche should take place by the end of 2017.

Purpose of the transaction

The purpose of the issuance of these Notes with Warrants is to provide Spineway with the financial means necessary to carry out its international-development plan and launch new innovative products. It could result in a capital investment of approximately €3.96M: €1.96M corresponding to the subscription of all the Notes and €2M corresponding to the exercise of all the Warrants.

Stéphane Le Roux, CEO of the Spineway Group, commented on this potential €3.96M in additional financial resources: “We are thrilled about this agreement with Yorkville Advisors that will allow us to diversify the financing we have to support our growth. The issuance of a first tranche of €1M by the end of the year will allow us to finance our development in new areas, such as in the USA, and accelerate the launch of our new products.”

Characteristics of the Tranche Warrants, Notes and Warrants

The main characteristics of the Tranche Warrants, Notes and Warrants (the detailed terms and conditions of which are available on the Company’s website) are as follows:

  • Main characteristics of the Tranche Warrants

The Tranche Warrants require their bearer, at the Company’s request(1) (a “Request“) or on the Investor’s initiative(2), to subscribe Notes with Warrants attached, i.e., one Note per Tranche Warrant exercised, at a price set at 98% of the par value of a Note. The Company can therefore request the exercise of the Tranche Warrants in order to allow the issuance of Notes in several tranches. Each exercise date of each Tranche Warrant is a “Tranche Warrant Exercise Date.”

The Tranche Warrants are freely transferable to any other fund managed by Yorkville Advisors but cannot be transferred to a third party without the Company’s prior approval, shall not be the subject of a request for admission to trading on Euronext Growth and therefore shall not be listed.

  • Main characteristics of the Notes

The Notes shall be issued in several Tranches. The aggregate principal amount of the first Tranche will be equal to €1M. The aggregate principal amount of each of the following Tranches shall, in principle, be equal to €0.5M, unless otherwise mutually agreed by the Investor and the Company.

The Notes have a par value of €10,000 each and are subscribed at 98% of par.

The Notes have a maturity of 12 months from their date of issuance. Upon maturity or an event of default(3), the Notes that have not been converted shall be redeemed by the Company at par (plus accrued interest, if any). The Notes do not bear interest (except in the event of default).

At its discretion, the Investor may convert all or any of its Notes into new and/or existing shares (a “Conversion“). Upon a Conversion, the Investor shall determine the number of Notes to be converted and the corresponding aggregate principal amount and interest (if any) so converted (the “Conversion Amount“). The number of shares to be issued to the Investor upon each Conversion will be equal to the Conversion Amount divided by 92% of the Market Price (as defined below) on the Conversion Date.

Upon a Conversion, the Company shall have the right at its sole discretion to remit to the Investor: (1) the corresponding new and/or existing shares (as described above), (2) the value in cash or (3) an amount in cash and new and/or existing shares.

If the Company chooses to remit a cash amount, such amount shall be equal to:

M = (Vn / P) * C

“M”: cash amount payable to the Note bearer;
“Pv”: bond claim that the Note represents (par value of a Note, plus accrued interest, if any);
“P”: 92% of Market Price;
“C”: daily volume weighted average price of the Company’s share on the Conversion Date.

The market price (the “Market Price“) shall be the lowest daily volume weighted average price of the Company’s share over the ten (10) consecutive trading days immediately preceding the applicable date (the “Pricing Period“). By way of exception, in the case of a Conversion, or upon exercise of Tranche Warrants on the Investor’s initiative, Pricing Period shall mean the trading days during which the Investor has not sold any share of the Company in the market among the ten (10) consecutive trading days immediately preceding the applicable date.

The Notes, which are freely transferable to any other fund managed by Yorkville Advisors but cannot be transferred to a third party without the Company’s prior approval, shall not be the subject of a request for admission to trading on Euronext Growth and therefore shall not be listed.

  • Main characteristics of the Warrants

Each Note shall be issued with a number of Warrants equal to the par value of a Note divided by the applicable strike price of the Warrants (the “Strike Price“). The Warrants shall immediately be detached from the Notes and each Warrant shall give its bearer the right to subscribe for one (1) new share in the Company, subject to possible adjustments.

The Strike Price of the Warrants attached to the Notes of the first Tranche shall be equal to 115% of the lower of (1) the Market Price on the issuance date of the Tranche Warrants (2) the Market Price on July 13, 2017, i.e., 3.2572 euros.

The Strike Price of the Warrants attached to the Notes of the subsequent Tranches shall be equal 115% of the Market Price on the date of the applicable Request (or Tranche Warrant Exercise Date in the case of an exercise of Tranche Warrants on the Investor’s initiative).

The Warrants shall be exercisable in new shares for a period of 5 years from their respective issuance dates.

The Warrants, which are freely transferable to any other fund managed by Yorkville Advisors but cannot be transferred to a third party without the Company’s prior approval, shall not be the subject of a request for admission to trading on Euronext Growth and therefore shall not be listed, unless the Company and the Investor agree otherwise.

For reference, based on the share’s closing price on July 27, 2017 (i.e., €3.66), the theoretical value of a Warrant would be between €0.78 and €1.69 depending on the volatility applied (between 30% and 60%). The theoretical value of a Warrant is obtained using the Black & Scholes formula based on the following hypotheses:

  • maturity: 5 years;
  • risk-free interest rate: 0%;
  • dividend payout rate: 0%.

New shares resulting from the Conversion of Notes or the exercise of Warrants

The new shares issued upon conversion of the Notes and/or exercise of the Warrants shall be admitted to trading on Euronext Growth as from their issuance, will carry immediate and current dividend rights and will be fully assimilated to and fungible with the existing ordinary shares.

The Company shall update a summary table on its website showing the Tranche Warrants, Notes, Warrants and number of shares outstanding.

Theoretical impact of the issuance of the Notes with Warrants attached (based on the Company share’s closing price on July 27, 2017, i.e., €3.66)

For reference, assuming the Company decides to remit only new shares upon Conversion of the Notes, the impact of the issuance of the Notes with Warrants attached would be as follows:

  • Impact of the issuance on the consolidated net assets per share (based on the shareholders’ equity as at December 31, 2016, and the number of shares making up the Company’s share capital as at July 27, 2017, i.e., 3,907,846 shares):
Consolidated net assets per share (in €)
Non-diluted basis Diluted basis(1)
1sttranche Total tranches 1sttranche Total tranches
Before issuance €0.47 €0.80
After issuance of a maximum of 296 982 (1st tranche) or of 593 964 (total tranches) new shares resulting from the Conversion of the Notes €0.65 €0.82 €0.95 €1.08
After issuance of a maximum of 564 361  (1st tranche) or of 1 099 438 (total tranches) new shares resulting from the Conversion of the Notes and the exercise of the Warrants €0.84 €1.13 €1.10 €1.35
(1) assuming the exercise of all the dilutive instruments existing to date that could result in the creation of a maximum of 390,786 new shares.
  • Impact of the issuance on the investment of a shareholder currently holding 1% of the Company’s share capital (based on the number of shares making up the Company’s share capital as at July 27, 2017, i.e., 3,907,846 shares):
Consolidated net assets per share (%)
Non-diluted basis Diluted basis (1)
1sttranche Total tranches 1sttranche Total tranches
Before issuance 1.00% 0.91%
After issuance of a maximum of 296 982 (1st tranche) or of 593 964  (total tranches) new shares resulting from the Conversion of the Notes 0.93% 0.87% 0.85% 0.80%
After issuance of a maximum of 564 361  (1st tranche) or of 1 099 438 (total tranches) new shares resulting from the Conversion of the Notes and the exercise of the Warrants 0.87% 0.78% 0.80% 0.72%
(1) assuming the exercise of all the dilutive instruments existing to date that could result in the creation of a maximum of 390,786 new shares.

The Company specifies that, upon Conversion of the Notes, it shall have the right to remit a cash amount and/or existing shares instead of new shares in order to limit dilution for its shareholders.

(1) The following conditions must be met on the day of the Request and the day the Warrants are exercised:

  • more than then (10) calendar days have passed since the conversion or the redemption in full of the Notes from the previous Tranches;
  • no material adverse change shall have occurred;
  • the closing price of the Company’s share is greater than or equal to €1.60;
  • no event of default or event that could constitute an event of default that is not resolved shall have occurred;
  • no impossibility for the holders of Notes to convert the Notes into shares shall have occurred in the previous 90 days;

no suspension of the listing of the Company’s shares (other than an intraday suspension by Euronext) shall have occurred in the previous 90 days;

  • the Company will have a number of authorized and available shares equal to at least (i) 2 times the number of shares to be issued upon conversion of the Notes to be issued and outstanding (based on the conversion price applicable on the date of the Request) plus (ii) 1 time the number of shares to be issued upon exercise of the Warrants to be issued.

(2) The following conditions must be met if a Tranche is issued on the Investor’s initiative:

  • the Company will have a number of authorized and available shares equal to at least (i) 2 times the number of shares to be issued upon conversion of the Notes to be issued and outstanding (based on the conversion price applicable on the date of the Request) plus (ii) 1 time the number of shares to be issued upon exercise of the Warrants to be issued;
  • the closing price of the Spineway share on the trading day prior to the Tranche Warrant Exercise Date is greater than or equal to €3.50. It is specified that if the closing price is between €3.50 (excluded) and €4.50 (included), the Investor may exercise up to 50 Tranche Warrants on its own initiative. If the closing price exceeds €4.50 (excluded), the Investor may exercise up to 100 Tranche Warrants on its own initiative.

(3) Events of default include, in particular, the suspension of the listing of the Company’s shares (other than a suspension of less than five (5) consecutive days at the Company’s request) and the Company’s failure to remit shares or cash owed to the Investor pursuant to the terms of the Issuance Agreement.

This press release is entered into in both English and French languages. In case of discrepancies, French language shall prevail.

SPINEWAY IS ELIGIBLE FOR THE PEA-PME (EQUITY SAVINGS PLAN FOR SMES)

Find out all about Spineway at www.spineway.com

Spineway designs, manufactures and markets innovative implants and surgical instruments for treating severe disorders of the spinal column.
Spineway has an international network of over 50 independent distributors and 90% of its turnover comes from exports.
Spineway, which is eligible for investment through FCPIs (French unit trusts specializing in innovation), received the OSEO Excellence award as well as the Deloitte Fast 50 award in 2011. Rhône Alpes INPI Patent Innovation Award (2013) – Talent INPI award (2015). 
ISIN code: FR0011398874 – Euronext Growth

Contacts:              

SPINEWAY

Investor Relations
David Siegrist – Finance Director
+33 (0)4 72 77 01 52
finance.dsg@spineway.com
AELIUM

Financial Communication
Jérôme Gacoin / Solène Kennis
+33 (0)1 75 77 54 68
skennis@aelium.fr

Attachments:

http://www.globenewswire.com/NewsRoom/AttachmentNg/d5916663-a95b-438c-b949-b93e46b9e13d