Park City, UT

3 days / 6 sessions
Current Issues in Spine

February 2-4, 2017

innovasis1-1-1200x982.jpg

February 17, 2017 OrthoSpineNews

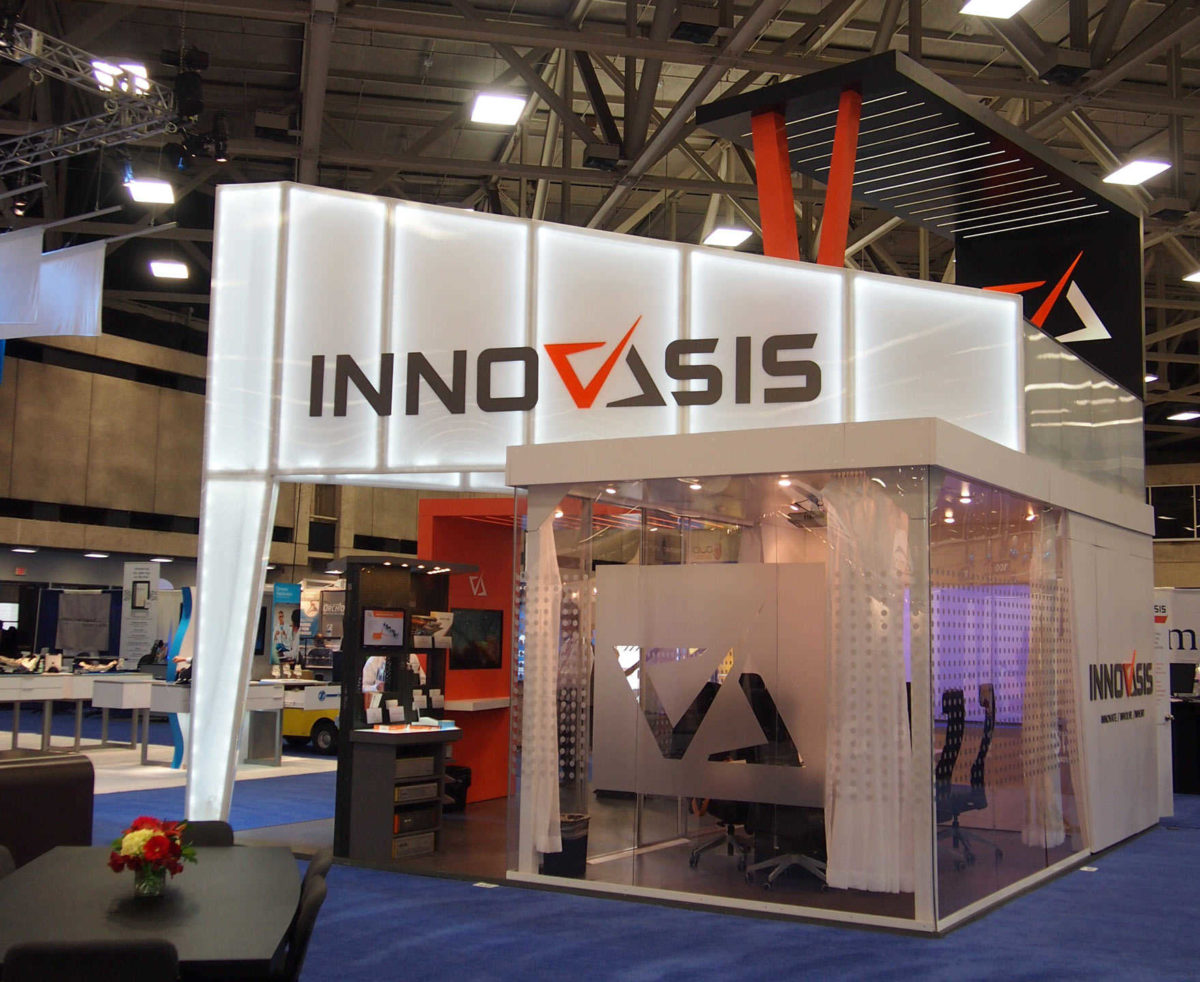
Mike joined the company in 2014 and most recently served as the Executive Vice President.  He brings over 20 years of executive leadership experience in medical device and spine including Johnson & Johnson and NuVasive. Innovasis posted significant growth in 2016 while introducing the Excella-MIS system and the PX HA PLIF cage to the market. They are positioned to launch several new products in 2017 and plan to continue building their executive team.

“I’m honored to have the opportunity to lead this extraordinary team. Our positive cash position and strong revenue growth will allow us to continue investing in innovation and talent, “said English.

Innovasis creates growth and value through product innovation and strategic acquisition.  It continues to expand it medical mission work through the International Ortho Neuro Foundation in South America and other nations in need. Innovasis is a manufacturer of spine and cranial implants based in Salt Lake City, UT.


You can learn more at www.innovasis.com


ofx-Billboard-Intro-Layer2.jpg

February 17, 2017 OrthoSpineNews

February 16, 2017

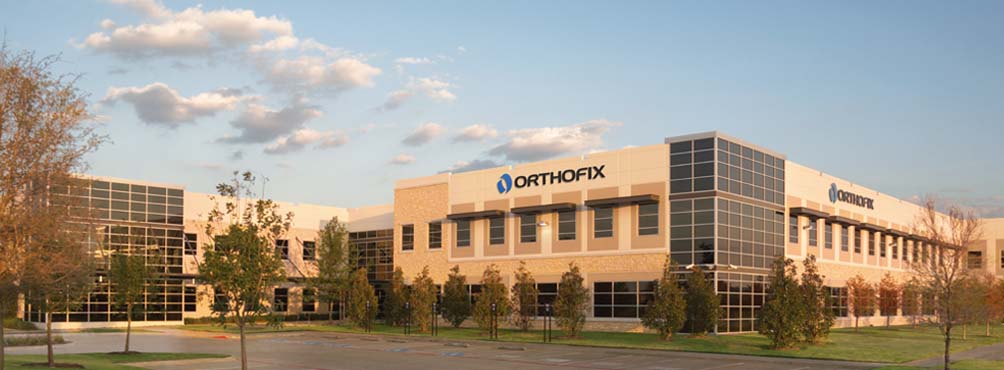
LEWISVILLE, Texas–(BUSINESS WIRE)–Orthofix International N.V. (NASDAQ:OFIX) (the “Company”) a diversified, global medical device company, today announced that it plans to release financial results for the fourth quarter and fiscal year 2016 after market close on Monday, February 27, 2017. Brad Mason, Chief Executive Officer, and Doug Rice, Chief Financial Officer, will host a conference call and webcast to review the Company’s results at 4:30 p.m. EST the same day.

Interested parties may access the conference call by dialing (866) 454-4209 in the U.S. and (913) 312-0839 outside the U.S., and referencing the conference ID 2108139. A replay of the call will be available for two weeks by dialing (888) 203-1112 in the U.S. and (719) 457-0820 outside the U.S., and entering the conference ID 2108139. A webcast of the conference call may be accessed by going to the Company’s website at www.orthofix.com, by clicking on the Investors link and then the Events and Presentations page.

About Orthofix:

Orthofix International N.V. is a diversified, global medical device company focused on improving patients’ lives by providing superior reconstructive and regenerative orthopedic and spine solutions to physicians worldwide. Headquartered in Lewisville, Texas, the Company has four strategic business units: BioStim, Biologics, Extremity Fixation and Spine Fixation. Orthofix products are widely distributed via the Company’s sales representatives and distributors. In addition, Orthofix is collaborating on research and development activities with leading clinical organizations such as Brown University, Sinai Hospital of Baltimore, Cleveland Clinic, Texas Scottish Rite Hospital for Children, and the Musculoskeletal Transplant Foundation. For more information, please visit www.orthofix.com.

Contacts

Orthofix International N.V.
Investor Contact:
Mark Quick, 214-937-2924
markquick@orthofix.com
or
Media Contact:
Denise Landry, 214-937-2529
deniselandry@orthofix.com


ucm541881-1.jpg

February 17, 2017 OrthoSpineNews

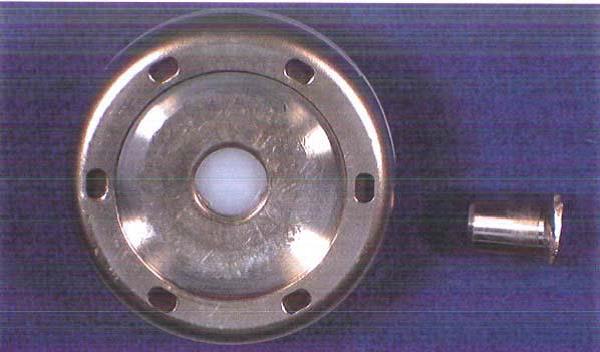
The FDA has identified this as a Class I recall, the most serious type of recall. Use of these devices may cause serious injuries or death.

Recalled Product:


757x468_Lab-1.jpg

February 17, 2017 OrthoSpineNews

EMMA NEWLANDS – 15 February 2017

Biomaterials business Collagen Solutions has revealed plans to raise up to £12 million and said it expects to reach profitability in 2019.

The Glasgow-based company, which develops and produces medical-grade collagen components for use in regenerative medicine, said the funding will reinforce its balance sheet, boosting confidence, speed up the progress of its core business and help develop new products.

It plans to raise up to about £8m in gross proceeds from current and new investors via a placing and open offer, subject to shareholder approval.

Furthermore, the Aim-quoted firm said it has received a conditional commitment from Norgine Ventures to subscribe up to £4m in secured private bonds with warrants.

Norgine Ventures is backed by European healthcare firm Norgine, and says it provides debt and debt-like funding to “innovative, fast-growing companies in the fields of healthcare and life sciences, in Europe and the US”.

Collagen Solutions said the net proceeds of the placing and open offer will go towards investment in the development and commercialisation of high-value device products, bring forward the launch of collagen-based implant ChondroMimetic, a key focus this year, and boost growth of its existing medical collagen supply business.


READ THE REST HERE


2012-11-06_ConforMIS_ConforMISNewOffice_WEB.jpg

February 17, 2017 OrthoSpineNews

BEDFORD, Mass., Feb. 15, 2017 (GLOBE NEWSWIRE) — ConforMIS, Inc. (NASDAQ:CFMS), a medical technology company that uses its proprietary iFit Image-to-Implant technology platform to develop, manufacture and sell joint replacement implants that are customized to fit each patient’s unique anatomy, announced today financial results for the fourth quarter and the year ended December 31, 2016.

Q4 Summary:

  • Total revenue of $21.7 million, up 14% year-over-year on a reported and constant currency basis
  • Product revenue of $21.4 million, up 14% year-over-year on a reported and constant currency basis
    — U.S. product revenue increased 21% year-over-year
    — Rest of World product revenue decreased 11% year-over-year on a reported basis and decreased 8% year-over-year on a constant currency basis
  • On January 6, 2017, the Company secured up to $50 million in debt financing from Oxford Finance LLC

“We reported solid revenue and gross margin results in the fourth quarter of 2016,” said Mark Augusti, President and Chief Executive Officer of ConforMIS, Inc. “Full-year 2016 product revenue increased 26 percent year-over-year on a reported basis and 27 percent year-over-year on a constant currency basis, at the higher-end of our guidance range.”

Three months ended December 31,
Increase/decrease
($, in thousands) 2016 2015  $
Change

%
Change

%
Change

 (as reported)
 (constant
currency)

United States $ 17,703 $ 14,627 $ 3,076 21 % 21 %
Rest of world 3,732 4,211 (479 ) -11 % -8 %
Product revenue 21,435 18,838 2,597 14 % 14 %
Royalty revenue 238 233 5 2 % 2 %
Total revenue $   21,673 $   19,071 $   2,602 14 % 14 %

Fourth Quarter 2016 Financial Results

Total revenue increased $2.6 million to $21.7 million, or 14% year-over-year on a reported and constant currency basis. Total revenue in the fourth quarter of 2016 and 2015 includes royalty revenue of $0.2 million related to patent license agreements.

Product revenue increased $2.6 million to $21.4 million, or 14% year-over-year on a reported and constant currency basis. U.S. product revenue increased $3.1 million to $17.7 million, or 21% year-over-year, and Rest of World product revenue decreased $0.5 million to $3.7 million, or 11% year-over-year on a reported basis and decreased 8% on a constant currency basis. Product revenue from sales of iTotal CR, iDuo and iUni decreased $0.3 million to $16.8 million, or 2% year-over-year on a reported basis and decreased 1% on a constant currency basis.  Product revenue from sales of iTotal CR, iDuo and iUni was driven by U.S. growth of 3% year-over-year and Rest of World decline of 16% on a reported basis and 13% on a constant currency basis. Product revenue from sales of iTotal PS increased $2.9 million to $4.6 million or 167% year-over-year on a reported and constant currency basis.

Total gross profit increased $1.7 million to $8.0 million, or 37% of revenue, in the fourth quarter of 2016, compared to $6.3 million, or 33% of revenue, in the fourth quarter of 2015. This increase in gross profit and gross margin was driven primarily by higher product revenue in 2016 compared to 2015.

Total operating expenses increased $0.9 million to $22.0 million, or 4% year-over-year. The increase in expenses was driven primarily by general and administrative expenses compared to the fourth quarter of 2015.

Net loss was $15.7 million, or $0.37 per basic share, in the fourth quarter of 2016, compared to a net loss of $15.0 million, or $0.37 per basic share, for the same period last year. Net loss per basic share calculations assume weighted-average basic shares outstanding of 42.1 million for the fourth quarter of fiscal year 2016, compared to 40.8 million in the same period last year.

Twelve months ended December 31
Increase/decrease
($, in thousands) 2016 2015  $
Change

%
Change

%
Change
 (as reported)  (constant
currency)
United States $ 62,366 $ 47,223 $ 15,143 32 % 32 %
Rest of world 16,555 15,568 987 6 % 10 %
Product revenue 78,921 62,791 16,130 26 % 27 %
Royalty revenue 978 4,096 (3,118 ) -76 % -76 %
Total revenue $   79,899 $   66,887 $   13,012 19 % 20 %

Fiscal Year 2016 Financial Results

Total revenue for the twelve-month period ended December 31, 2016 increased $13.0 million to $79.9 million, or 19% year-over-year on a reported basis and 20% on a constant currency basis. Total revenue included royalty revenue of $1.0 million for the year ended 2016 and $4.1 million for the year ended 2015 related to patent license agreements.  The decrease in royalty revenue related to lump-sum payments received upon the signing of patent license agreements in 2015.

Product revenue increased $16.1 million to $78.9 million, or 26% year-over-year on a reported basis and 27% on a constant currency basis. U.S. product revenue increased $15.1 million to $62.4 million, or 32% year-over-year, and Rest of World product revenue increased $1.0 million to $16.6 million, or 6% year-over-year on a reported basis and 10% on a constant currency basis. Product revenue from sales of iTotal CR, iDuo and iUni increased $5.0 million to $64.5 million, or 8% year-over-year on a reported basis and 9% on a constant currency basis. Product revenue from sales of iTotal PS increased $11.1 million to $14.4 million, or 339% year-over-year on a reported basis and 341% on a constant currency basis.

Total gross profit increased $4.9 million to $26.7 million, or 33% of revenue, in 2016 compared to $21.8 million, or 33% of revenue, in 2015. Total operating expenses increased $5.1 million to $82.9 million, or 7% year-over-year in 2016.

Net loss was $57.6 million, or $1.39 per basic share, for 2016 compared to a net loss of $57.2 million, or $2.60 per basic share, for 2015. Net loss per basic share calculations assume weighted-average basic shares outstanding of 41.5 million for fiscal year 2016, compared to 22.0 million in the same period last year.

As of December 31, 2016, the Company’s cash and cash equivalents and investments totaled $65.5 million, compared to $117.2 million last year.  As previously announced last month, the Company has secured up to $50 million in term debt financing from Oxford Finance.

2017 Financial Guidance

For the full year 2017, the Company expects total revenue in a range of $80 million to $84 million.  The Company’s 2017 revenue guidance assumes the following:

  • Royalty revenue of approximately $0.8 million related to ongoing patent license royalty payments.
  • Product revenue in a range of $79 million to $83 million, representing year-over-year growth of 0% to 5% on a reported basis and 1% to 6% on a constant currency basis.
  • Impacting 2017 product revenue growth is a change in the reimbursement of partial knee replacement procedures in Germany.  In December it was announced that the reimbursement for customized partial knee procedures will be reimbursed at the same rate as the off-the-shelf partial knee procedures, beginning January 2017.
  • Also impacting our 2017 product revenue growth, when compared to 2016 revenue, is the incremental sales contribution to 2016 revenue results from rescheduled cases, including reduction in order lead times, subsequent to the 2015 recall.

For the full year 2017, the Company expects total gross margin in a range of 36% to 38%.

For the first quarter of 2017, the Company is also providing one-time quarterly guidance of total revenue in a range of $17.7 million to $18.7 million.

“Our 2017 guidance for constant currency product revenue growth in the range of 1 percent to 6 percent is not reflective of the underlying health of our U.S. business which we expect to grow in the high-single digit to mid-teens percentage this year over last year,” said Mark Augusti. “Our Rest of World business will be impacted by recent changes to the partial knee replacement reimbursement environment in Germany, our largest international market.

Mark Augusti continued, “2017 will be a transition year for ConforMIS as we focus on improving our long-term growth and profitability profile. We expect continued strength coming from our iTotal PS, which was fully launched in the first half of 2016, and we are focused on improving our commercial execution to drive better results in our base business going forward. Importantly, we expect continued improvements in our gross margin in 2017.”

Note on Non-GAAP Financial Measures

In addition to disclosing financial measures prepared in accordance with U.S. generally accepted accounting principles (GAAP), the Company provides certain information regarding the Company’s financial results or projected financial results on a non-GAAP “constant currency basis.” This information estimates the impact of changes in foreign currency rates on the translation of the Company’s current or projected future period financial results as compared to the applicable comparable period. This impact is derived by taking the adjusted current or projected local currency results and translating them into U.S. Dollars based upon the foreign currency exchange rates for the applicable comparable period. It does not include any other effect of changes in foreign currency rates on the Company’s results or business. Non-GAAP information is not a substitute for, and is not superior to, information presented on a GAAP basis.

Conference Call

As previously announced, ConforMIS will conduct a conference call and webcast today at 4:30 PM Eastern Time. Management will discuss financial results and strategic matters. To participate in the conference call, please call 877-809-6331 (or 615-247-0224 for international) and use conference ID number 55924641 or listen to the webcast in the investor relations section of the company’s website at ir.conformis.com. The online archive of the webcast will be available on the company’s website for 30 days.

About ConforMIS, Inc.

ConforMIS is a medical technology company that uses its proprietary iFit Image-to-Implant technology platform to develop, manufacture and sell joint replacement implants that are individually sized and shaped, or customized, to fit each patient’s unique anatomy. ConforMIS offers a broad line of customized knee implants and pre-sterilized, single-use instruments delivered in a single package to the hospital. In clinical studies, ConforMIS iTotal CR demonstrated superior clinical outcomes, including better function and greater patient satisfaction, compared to traditional, off-the-shelf implants. ConforMIS owns or exclusively in-licenses approximately 450 issued patents and pending patent applications that cover customized implants and patient-specific instrumentation for all major joints.

For more information, visit www.conformis.com. To receive future releases in e-mail alerts, sign up at http://ir.conformis.com/.

Cautionary Statement Regarding Forward-Looking Statements

Any statements in this press release about our future expectations, plans and prospects, including statements about our strategy, future operations, future financial position and results, market growth, total revenue and revenue mix by product and geography, gross margin, operating trends, the potential impact and advantages of using customized implants, as well as other statements containing the words “anticipate,” “believe,” “continue,” “could,” “estimate,” “expect,” “intend,” “may,” “might,” “plan,” “potential,” “predict,” “project,” “should,” “target,” “will,” or “would” and similar expressions, constitute forward-looking statements within the meaning of the safe harbor provisions of The Private Securities Litigation Reform Act of 1995. We may not actually achieve the plans, intentions or expectations disclosed in our forward-looking statements, and you should not place undue reliance on our forward-looking statements. Actual results or events could differ materially from the plans, intentions and expectations disclosed in the forward-looking statements we make as a result of a variety of risks and uncertainties, including risks related to our estimates regarding the potential market opportunity for our current and future products, our expectations regarding our revenue, gross margin, expenses, revenue growth, and other results of operations, and the other risks and uncertainties described in the “Risk Factors” sections of our public filings with the Securities and Exchange Commission. In addition, the forward-looking statements included in this press release represent our views as of the date hereof. We anticipate that subsequent events and developments may cause our views to change. However, while we may elect to update these forward-looking statements at some point in the future, we specifically disclaim any obligation to do so. These forward-looking statements should not be relied upon as representing our views as of any date subsequent to the date hereof.

CONFORMIS, INC. AND SUBSIDIARIES
Consolidated Statements of Operations
(unaudited)
(in thousands, except share and per share data)
Three Months Ended
December 31,

Twelve Months Ended
December 31,
2016 2015
2016 2015
Revenue
Product $ 21,435 $ 18,838 $ 78,921 $ 62,791
Royalty 238 233 978 4,096
Total revenue 21,673 19,071   79,899 66,887
Cost of revenue 13,628 12,731 53,192 45,102
Gross profit 8,045 6,340 26,707 21,785
Operating expenses
Sales and marketing 10,023 9,974 41,086 37,558
Research and development 4,134 4,779 16,608 16,997
General and administrative 7,872 6,401 25,157 23,191
Total operating expenses 22,029 21,154 82,851 77,746
Loss from operations (13,984) (14,814) (56,144) (55,961)
Other income and expenses
Interest income 77 46 486 138
Interest expense (34) (5) (138) (1,385)
Loss on extinguishment of debt (205) (205)
Other income (expense) (1,764) (1,730) 208
Total other expenses (1,721) (164) (1,382) (1,244)
Loss before income taxes (15,705) (14,978) (57,526) (57,205)
Income tax provision 36 12 63 41
Net loss $ (15,741) $ (14,990) $ (57,589) $ (57,246)
Net loss per share – basic and diluted $ (0.37) $ (0.37) $ (1.39) $ (2.60)
Weighted average common shares outstanding – basic and diluted 42,081,490 40,824,571 41,521,629 21,993,066
 CONFORMIS, INC. AND SUBSIDIARIES
Consolidated Balance Sheets
(in thousands, except share and per share data)
December 31, 2016 December 31, 2015
Assets  (unaudited) 
Current Assets
Cash and cash equivalents $ 37,257 $ 117,185
Investments 28,242
Accounts receivable, net 14,675 14,867
Inventories 11,720 11,520
Prepaid expenses and other current assets 3,954 2,451
Total current assets 95,848 146,023
Property and equipment, net 15,084 10,966
Other Assets
Restricted cash 300 600
Intangible assets, net 746 995
Goodwill 753 753
Other long-term assets 79 32
Total assets $ 112,810 $ 159,369
Liabilities and stockholder’s equity
Current liabilities
Accounts payable $ 5,474 $ 4,718
Accrued expenses 8,493 7,811
Deferred revenue 305 305
Current portion of long-term debt 295
Total current liabilities 14,272 13,129
Other long-term liabilities 164 220
Deferred revenue 4,320 4,625
Long-term debt 183
Total liabilities 18,755 18,157
Commitments and contingencies
Stockholders’ equity
Preferred stock, $0.00001 par value:
Authorized: 5,000,000 shares authorized at December 31, 2016 and December 31, 2015, respectively, no shares outstanding as of December 31, 2016 and December 31, 2015.
Common stock, $0.00001 par value:
Authorized: 200,000,000 shares at December 31, 2016 and December 31, 2015; 43,399,547 and 41,110,127 shares issued and outstanding at December 31, 2016 and December 31, 2015, respectively
Additional paid-in capital 476,486 467,075
Accumulated deficit (382,930) (325,342)
Accumulated other comprehensive loss 497 (521)
Total stockholders’ equity 94,055 141,212
Total liabilities and stockholders’ equity $ 112,810 $ 159,369
CONTACT: 
Investor contact
Oksana Bradley
ir@conformis.com
(781) 374-5598
mazor-spine-surgery-st-francis-hospital-memphis.jpg

February 17, 2017 OrthoSpineNews

February 16, 2017

CAESAREA, Israel–(BUSINESS WIRE)–Mazor Robotics Ltd. (TASE:MZOR; NASDAQGM:MZOR), a pioneer and a leader in the field of surgical guidance systems, reported record revenue for the fourth quarter and full year ended December 31, 2016. As previously announced, the Company received purchase orders for 21 systems in the fourth quarter and ended the year with a backlog of 21 systems, including 18 Mazor X systems, its transformative platform for spine surgeries, which was commercially launched in October.

“Our record performance in the fourth quarter and success throughout the year reinforces 2016 as a strategic turning point for the Company,” commented Ori Hadomi, Chief Executive Officer. “We have greatly enhanced our leadership position in the spine market with the implementation of the Medtronic co-marketing and co-promotional agreement and the launch of the transformational Mazor X system. While our systems order growth is impressive, our high utilization rate and recurring revenue growth illustrates the benefits Mazor is bringing to both surgeon and patient. With a strong backlog, we enter 2017 with momentum to continue our growth.”

FOURTH QUARTER 2016 FINANCIAL RESULTS ON IFRS BASIS (“GAAP”)

Revenue for the three months ended December 31, 2016 increased 59% to $14.0 million compared to $8.8 million in the year-ago fourth quarter. U.S. revenue increased 88% to $12.6 million compared to $6.7 million in the year-ago fourth quarter, as the Company recognized revenue from 13 Mazor X and two Renaissance systems, compared to ten Renaissance systems in the year-ago fourth quarter. The Company ended the quarter with a backlog of 21 systems; revenue from these systems is expected to be recorded in 2017, generally, when the systems are supplied. International revenue was $1.4 million compared to $2.1 million in the year-ago fourth quarter, as the Company recognized revenue from three Renaissance systems, compared to four Renaissance systems in the year-ago fourth quarter. Recurring revenue from system kit sales, services and other increased 29% to $4.5 million in the fourth quarter of 2016, compared to $3.5 million in the year-ago fourth quarter. The increase is attributed to high utilization rates and increase of the install base.

The Company’s gross margin for the three months ended December 31, 2016 was 70.5% compared to 78.0% in the year-ago fourth quarter. The decrease is attributed mainly to discounted price to our distribution partner, Medtronic, and the higher manufacturing costs of the Mazor X, compared to the Renaissance system. Total operating expenses were $14.2 million compared to $9.8 million in the year-ago fourth quarter, primarily reflecting the Company’s increased investments in sales and marketing activities. Operating loss was $4.3 million compared to an operating loss of $2.9 million in the year-ago fourth quarter. Net loss for the fourth quarter of 2016 was $4.3 million, or $0.09 per share, compared to a net loss of $2.9 million, or $0.07 per share, for the year-ago fourth quarter.

Cash used in operating activities was $1.9 million compared to $4.3 million used in last year’s fourth quarter. The decrease is mainly due to high collection from customers, offset by higher payments to suppliers. As of December 31, 2016, cash, cash equivalents and investments totaled $61.8 million.

FOURTH QUARTER 2016 FINANCIAL RESULTS ON NON-GAAP BASIS

The tables below include reconciliation of the Company’s GAAP results to non-GAAP results. The reconciliation relates to non-cash expenses in the amount of $1.1 million with respect to amortization of intangible assets and to share-based expenses recorded in the fourth quarter of 2016. On a non-GAAP basis, the net loss in the fourth quarter of 2016 was $3.1 million, or $0.07 per share, compared to $2.1 million, or $0.05 per share, for the year-ago fourth quarter.

FULL YEAR ENDED DECEMBER 31, 2016 FINANCIAL RESULTS ON IFRS BASIS (“GAAP”)

For the full year ended December 31, 2016, revenue increased 39% to $36.4 million compared to $26.1 million for the full year ended December 31, 2015. U.S. revenue increased 51% to $30.7 million compared to $20.3 million in the full year ended December 31, 2015, as the Company recognized revenue from 30 systems, compared to 16 systems in the full year ended December 31, 2015. International revenue was $5.7 million compared to $5.8 million in the full year ended December 31, 2015, as the Company recognized revenue from 11 Renaissance systems, compared to eight Renaissance systems in the full year ended December 31, 2015. Recurring revenue totaled $16.8 million compared to $12.7 million for the full year ended December 31, 2015. The growth in recurring revenue is attributed to the increase of the install base of the Company’s Renaissance system in the U.S. and globally.

Gross margin for the full year ended December 31, 2016 was 71.6% compared to 77.7% for the full year ended December 31, 2015. The decrease is mainly attributed to the discounted price to our distribution partner, the lower price of Renaissance (effective Q3 2016) and the higher manufacturing costs of the Mazor X, compared to the Renaissance system. Total operating expenses were $45.1 million compared to $35.6 million in the full year ended December 31, 2015, primarily reflecting the Company’s increased investments in sales and marketing activities. Operating loss was $19.0 million compared to an operating loss of $15.3 million in the full year ended December 31, 2015. Net loss for the full year ended December 31, 2016 was $18.7 million, or $0.42 per share, compared to $15.4 million, or $0.36 per share for the full year ended December 31, 2015.

Cash used in operating activities was $10.1 million compared to $11.6 million used in the full year ended December 31, 2015. The decrease is mainly due to high collection from customers.

FULL YEAR ENDED DECEMBER 31, 2016 FINANCIAL RESULTS ON NON-GAAP BASIS

The tables below include reconciliation of the Company’s GAAP results to non-GAAP results. The reconciliation relates to non-cash expenses in the amount of $2.6 million with respect to capitalization of research and development costs, amortization of intangible assets and to share-based expenses recorded in 2016. On a non-GAAP basis, the net loss for the full year ended December 31, 2016 was $16.1 million, or $0.36 per share, compared to a net loss of $12.3 million, or $0.29 per share, for the full year ended December 31, 2015.

CONFERENCE CALL INFORMATION

The Company will host a conference call to discuss these results on February 16, 2017 at 8:30am ET (3:30 PM IST). Investors within the United States interested in participating are invited to call 888-312-3052. Participants in Israel can use the toll free dial-in number 1 80 924 5905. All other international participants can use the dial-in number 719-457-2695.

A replay of the event will be available for two weeks following the conclusion of the call. To access the replay, callers in the United States can call 1-866-375-1919 and reference the Replay Access Code: 2887710. All international callers can dial +1 719-457-0820, using the same Replay Access Code. To access the webcast, please visit www.mazorrobotics.com and select ‘Investor Relations.’

Use of Non-GAAP Measures

In addition to disclosing financial results calculated in accordance with generally accepted accounting principles in conformity with International Financial Reporting Standards (GAAP), this press release contains Non-GAAP financial measures for gross profit, operating expenses, operating loss, net loss and basic and diluted earnings per share that exclude the effects of capitalization of research and development costs, non-cash expense of amortization of intangible assets and share-based expenses. Management believes that these non-GAAP financial measures provide meaningful supplemental information regarding the Company’s performance that enhances management’s and investors’ ability to evaluate the Company’s net income and earnings per share and to compare them to historical net income and earnings per share.

The presentation of this non-GAAP financial information is not intended to be considered in isolation or as a substitute for the financial information prepared and presented in accordance with GAAP. Management uses both GAAP and non-GAAP measures when operating and evaluating the Company’s business internally and therefore decided to make these non-GAAP adjustments available to investors.

About Mazor

Mazor Robotics (TASE:MZOR; NASDAQGM:MZOR) believes in healing through innovation by developing and introducing revolutionary technologies and products aimed at redefining the gold standard of quality care. Mazor Robotics Guidance System enables surgeons to conduct spine and brain procedures in an accurate and secure manner. For more information, please visit www.MazorRobotics.com.

Forward-Looking Statements

This press release contains forward-looking statements within the meaning of the Private Securities Litigation Reform Act of 1995 and other securities laws. Any statements in this release about future expectations, plans or prospects for the Company, including without limitation, statements regarding the Company’s expectations for 2017, the amount of and timing of recording of additional revenue from backlog, and other statements containing the words “believes,” “anticipates,” “plans,” “expects,” “will” and similar expressions are forward-looking statements. These statements are only predictions based on Mazor’s current expectations and projections about future events. There are important factors that could cause Mazor’s actual results, level of activity, performance or achievements to differ materially from the results, level of activity, performance or achievements expressed or implied by the forward-looking statements. Those factors include, but are not limited to, the impact of general economic conditions, competitive products, product demand and market acceptance risks, reliance on key strategic alliances, fluctuations in operating results, and other factors indicated in Mazor’s filings with the Securities and Exchange Commission (SEC) including those discussed under the heading “Risk Factors” in Mazor’s annual report on Form 20-F filed with the SEC on May 2, 2016 and in subsequent filings with the SEC. For more details, refer to Mazor’s SEC filings. Mazor undertakes no obligation to update forward-looking statements to reflect subsequent occurring events or circumstances, or to changes in our expectations, except as may be required by law.

Mazor Robotics Ltd.
CONSOLIDATED STATEMENT OF PROFIT OR LOSS
(U.S. Dollars in thousands, except per share data)
Twelve month period Three month period
ended December 31, ended December 31,
2016 2015 2016 2015
(Unaudited) (Audited) (Unaudited) (Unaudited)
Revenue $ 36,379 $ 26,096 $ 14,043 $ 8,818
Cost of revenue 10,330 5,827 4,148 1,940
Gross profit 26,049 20,269 9,895 6,878
Operating costs and expenses:
Research and development 5,736 6,324 1,709 1,585
Selling and marketing 33,637 24,947 10,856 7,115
General and administrative 5,697 4,305 1,625 1,072
Total operating costs and expenses 45,070 35,576 14,190 9,772
Loss from operations (19,021) (15,307) (4,295) (2,894)
Financing income, net 397 135 52 43
Loss before taxes on income (18,624) (15,172) (4,243) (2,851)
Income tax expense 44 213 23 59
Net loss $ (18,668) $ (15,385) $ (4,266) $ (2,910)
Net loss per share – Basic and diluted $ (0.42) $ (0.36) $ (0.09) $ (0.07)
Weighted average common shares outstanding – Basic and diluted 44,881 42,284 47,560 42,349
Mazor Robotics Ltd.
CONSOLIDATED STATEMENTS OF FINANCIAL POSITION AS OF
(U.S. Dollars in thousands)
December 31, December 31,
2016 2015
(Unaudited) (Audited)
Current assets
Cash and cash equivalents $ 14,954 $ 13,519
Short-term investments 37,862 21,687
Trade receivables 8,225 5,002
Other current assets 1,728 1,420
Inventory 4,715 2,777
Total current assets 67,484 44,405
Non-current assets
Long-term investments 9,017 5,023
Property and equipment, net 3,615 1,432
Intangible assets, net 2,258
Other non-current assets 351 110
Total non-current assets 15,241 6,565
Total assets $ 82,725 $ 50,970
Current liabilities
Trade payables $ 5,018 $ 2,219
Deferred revenue 4,031 1,221
Other current liabilities 8,462 4,831
Total current liabilities 17,511 8,271
Non-current liabilities
Employee benefits 325 299
Total non-current liabilities 325 299
Total liabilities 17,836 8,570
Equity
Share capital 124 110
Share premium 174,647 136,107
Amounts allocated to share options 77
Capital reserve for share-based payment transactions 9,859 7,179
Foreign currency translation reserve 2,119 2,119
Accumulated loss (121,860) (103,192)
Total equity 64,889 42,400
Total liabilities and equity $ 82,725 $ 50,970
Mazor Robotics Ltd.
CONSOLIDATED CASH FLOW STATEMENTS
(U.S. Dollars in thousands)
Twelve month period Three month period
ended December 31, ended December 31,
2016 2015 2016 2015
(Unaudited) (Audited) (Unaudited) (Unaudited)
Cash flows from operating activities:
Loss for the period $ (18,668) $ (15,385) $ (4,266) $ (2,910)
Adjustments:
Depreciation and amortization 822 527 346 129
Gain on sale of property and equipment (6)
Finance (income) expenses, net (275) (207) 38 30
Share-based expenses 4,439 3,091 1,061 832
Income tax expense 44 213 23 59
5,024 3,624 1,468 1,050
Change in inventory (1,938) 273 (650) (146)
Change in trade and other accounts receivable (3,512) (2,408) (5,588) (3,517)
Change in prepaid lease fees (20) 6 (2) 4
Change in trade and other accounts payable 8,723 2,217 7,088 1,064
Change in employee benefits 26 21 (13) 9
3,279 109 835 (2,586)
Interest received 301 194 66 145
Income tax paid (38) (114) (30)
263 80 66 115
Net cash used in operating activities (10,102) (11,572) (1,897) (4,331)
Cash flows from investing activities:
Proceeds from (Purchase of ) short-term investments, net (11,094) 9,816 523 (3,929)
Purchase of long-term investments (9,823) (7,538) (917) (60)
Proceeds from sale of long-term investments 748 992 250
Purchase of property and equipment (2,361) (702) (626) (266)
Capitalization of development costs (1,902) (385)
Net cash provided by (used in) investing activities (24,432) 2,568 (1,155) (4,255)
Cash flows from financing activities:
Proceeds from issuance of ADR’s, net 31,416
Proceeds from exercise of share options by employees and
service providers 4,100 370 513 10
Proceeds from exercise of warrants by investors 481
Net cash provided by financing activities 35,997 370 513 10
Net increase (decrease) in cash and cash equivalents 1,463 (8,634) (2,539) (8,576)
Cash and cash equivalents at the beginning of the period 13,519 22,255 17,597 22,283
Effect of exchange rate differences on balances of
cash and cash equivalents (28) (102) (104) (188)
Cash and cash equivalents at the end of the period $ 14,954 $ 13,519 $ 14,954 $ 13,519
Supplementary cash flows information:
Purchase of property and equipment on credit $ (566) $ $ (566) $
Issuance costs in credit $ (20) $ $ (20) $
Mazor Robotics Ltd.
RECONCILIATIONS OF GAAP TO NON-GAAP FINANCIAL MEASURES
(U.S. Dollars in thousands, except per share data)
(UNAUDITED)
Twelve month period Three month period
ended December 31, ended December 31,
2016 2015 2016 2015
GAAP gross profit $ 26,049 $ 20,269 $ 9,895 $ 6,878
Amortization of intangible assets 74 74
Share-based expense 207 130 37 39
Non-GAAP gross profit $ 26,330 $ 20,399 $ 10,006 $ 6,917
GAAP gross profit as percentage of revenues 71.6% 77.7% 70.5% 78.0%
Non-GAAP gross profit as percentage of revenues 72.4% 78.2% 71.3% 78.4%
GAAP operating expenses $ 45,070 $ 35,576 $ 14,190 $ 9,772
Share-based expenses:
Research and development 783 475 88 131
Selling and marketing 2,435 1,575 463 456
General and administrative 1,444 911 473 206
Research and development – capitalization (2,332)
Non-GAAP operating expenses $ 42,740 $ 32,615 $ 13,166 $ 8,979
GAAP operating loss $ (19,021) $ (15,307) $ (4,295) $ (2,894)
Non-GAAP operating loss $ (16,410) $ (12,216) $ (3,160) $ (2,062)
GAAP net loss $ (18,668) $ (15,385) $ (4,266) $ (2,910)
Share-based expenses 4,869 3,091 1,061 832
Research and development – capitalization (2,332)
Amortization of intangible assets 74 74
Non-GAAP net loss $ (16,057) $ (12,294) $ (3,131) $ (2,078)
GAAP basic and diluted loss per share $ (0.42) $ (0.36) $ (0.09) $ (0.07)
Non-GAAP basic and diluted loss per share $ (0.36) $ (0.29) $ (0.07) $ (0.05)

Contacts

U.S. Contacts:
EVC Group
Investors
Michael Polyviou, 212-850-6020
mpolyviou@evcgroup.com
or
Doug Sherk, 646-445-4800
dsherk@evcgroup.com


vti_moved_image_3-1024x700.jpg

February 17, 2017 OrthoSpineNews

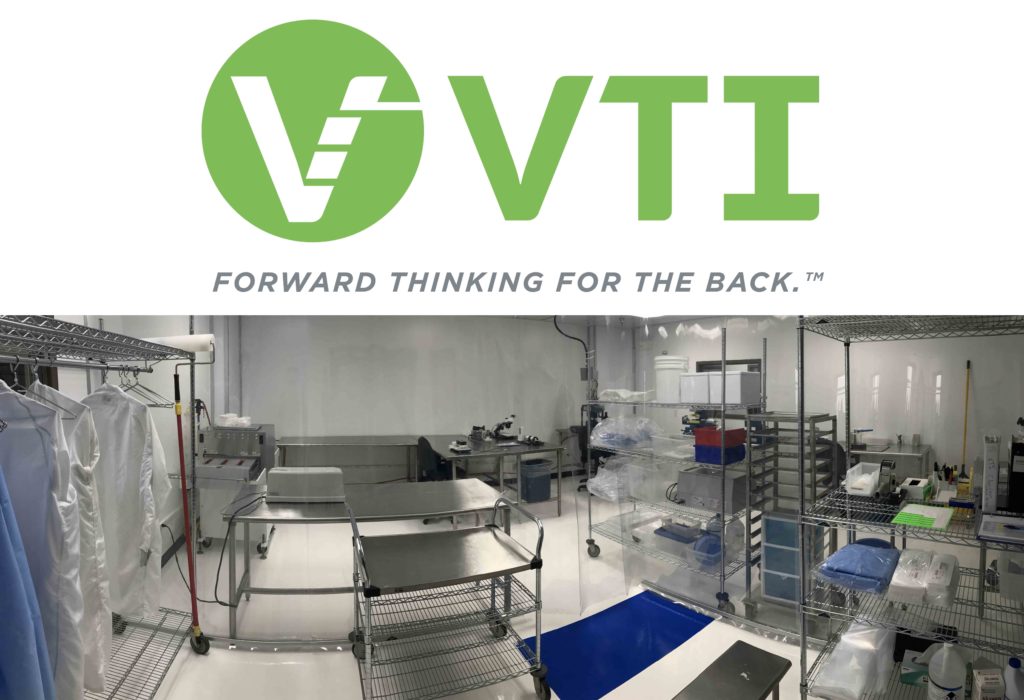
Vertebral Technologies, Inc. a MIS spinal implant medical device company based in Minneapolis, MN, has successfully moved their facilities from Minnetonka, MN to Minneapolis, MN. Brian Thron Director of Marketing says “the contemporary space compliments the company’s latest rebrand, with its simplistic design and modern color scheme. I’m pleased to call this space VTI’s new home”.

“VTI’s new ISO Class 8 Controlled Environment is fully operational post the certification and validation testing process. In addition, the new facility allows VTI to take advantage of increased efficiency across multiple departments with a new office layout that encourages collaboration to everyday operations. We are looking forward to these operative advantages moving forward as VTI grows in 2017”. says Director of Manufacturing Brian Holmberg.

President & CEO Matt Kyle stated “We are excited to be in our new space. The VTI team did a tremendous job of executing the move without disruption. The new space helps everyone align with our organizational objectives and growth focused culture. The feedback we have received, both internal and external, has been very positive.”

ABOUT VTI – VERTEBRAL TECHNOLOGIES, INC.
VTI – Vertebral Technologies, Inc. is a privately held company based in Minneapolis, MN, USA. VTI is dedicated to the design, development, manufacturing and marketing of medical devices to address painful conditions of the spine through less-invasive surgical approaches. VTI’s products utilize its unique modular-assembly technology to deliver solutions optimized for both surgeons and their patients. VTI sells its InterFuse® modular interbody fusion devices worldwide.

For more information, visit: http://www.vti-spine.com or contact Brian Thron at marketing(at)vti-spine(dot)com or + 1.877.912.5401.


C4yvk8SWMAIvuAi-1.jpg

February 17, 2017 OrthoSpineNews

February 16, 2017

CASTEL SAN PIETRO, Switzerland–(BUSINESS WIRE)–Building on its success in the hip, knee and spine product areas, family-owned orthopedics leader Medacta International is expanding into the shoulder arthroplasty market. The company today announced the completion of the first surgery utilizing its Medacta Shoulder System, performed by Professor Ralph Hertel in Bern, Switzerland.

“The procedure was a success,” said Professor Hertel, who has specialized in shoulder and elbow surgery for more than two decades. “As expected, the early postoperative phase and hospital stay were uneventful, and the patient is on a smooth path to recovery. We’re very pleased.”

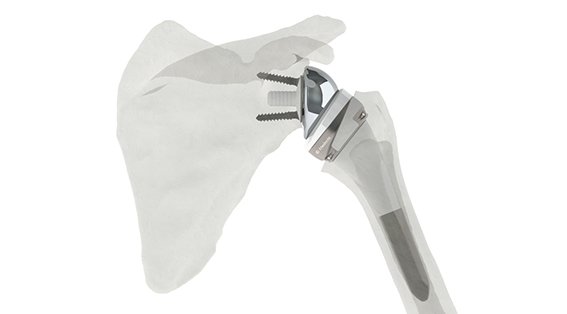
The Medacta Shoulder System is a modular solution that features a broad range of options, including wide-ranging sizes, adjustable offset, innovative configurations and the CT-based MyShoulder 3D preoperative planning solution for patient-specific humeral and glenoid guides.

“With the Medacta Shoulder System, we are entering the fast growing upper extremity market with the same patient-centric vision and ambition that characterized our growth and success in knee, hip and spine technology: delivering innovation through high-level surgical education and providing real benefits to patients and healthcare system sustainability,” said Alberto Siccardi, President and Founder of Medacta International.

Designed by a group of expert surgeons from Europe, Australia and the United States, the Medacta Shoulder System also offers the flexibility to move from a total to reverse arthroplasty without the need to revise all components.

“The most important consideration in orthopedics and joint replacement is not only to improve implant design, but also to elevate design standards. With the Medacta Shoulder System, we aim to solve the issues related to implant design, polyethylene wear and the reproducibility of results,” said Francesco Siccardi, Executive Vice President of Medacta International.

The Medacta Shoulder System is currently under clinical evaluation by the surgeon design team and will be available in 2018.

For more information about Medacta, please visit medacta.com or follow @Medacta on Twitter.

About Medacta

Medacta® International is a world leading manufacturer of orthopedic implants, neurosurgical systems, and instrumentation. Medacta’s revolutionary approach and responsible innovation have resulted in standard of care breakthroughs in hip replacement with the AMIS®system and total knee replacement with MyKnee® patient matched technology. Over the last 10 years, Medacta has grown dramatically by taking a different approach and placing value on all aspects of the care experience from design to training to sustainability. Medacta is headquartered in Castel San Pietro, Switzerland, and operates in over 30 countries. To learn more about Medacta International, please visit www.medacta.com or follow @Medacta on Twitter.

Contacts

For Medacta International, Inc.
Jill Bongiorni, 516-729-2250
Jill@torchcomllc.com


NuVasive_1_Full.jpg

February 17, 2017 OrthoSpineNews

By Patrick Lantrip – Friday, February 17, 2017

Medical device company NuVasive Inc. has been approved for an 11-year tax incentive that will allow them to invest $116 million into their southeast Memphis facility and create 15 net new jobs.

The Economic Development Growth Engine board approved the Jobs PILOT (payment-in-lieu-of-taxes) incentive at its Wednesday, Feb. 15, meeting.

San Diego-based NuVasive plans to spend $115 million on new surgical and computer equipment and $700,000 on renovations to its regional office and distribution center at 4670 E. Shelby Drive. The average salary of the 15 new jobs will be $38,000.

“We always get excited about new projects coming to town,” said EDGE board member Larry Jackson. “But I want us to be just as excited when an existing success story wants to expand in Memphis and Shelby County.”

If NuVasive invests an additional $38 million within four years, for a total capital investment of $155 million, the company will receive a one-year extension on its PILOT.


READ THE REST HERE


258292_84919_repro.jpg

February 16, 2017 OrthoSpineNews

Tuesday, February 14, 2017

A group of doctors has high hopes that an artificial disc, owned exclusively by a Jamaican-born doctor, can be used as a tool to drive medical tourism in Jamaica.

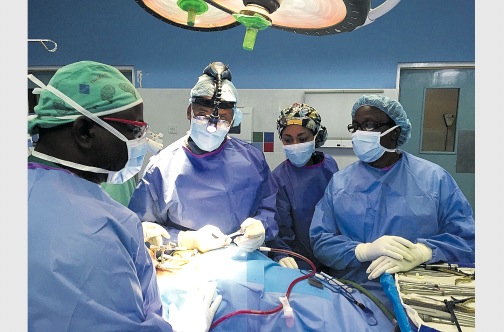
The technology was used for the first time in a four-level disc replacement procedure at the Andrews Memorial Hospital in St Andrew on February 1. The surgical procedure was performed by orthopaedic spinal surgeon Dr Kingsley Chin, who was born in Buff Bay, Portland.

Chin is CEO of KIC Ventures, a venture capital firm focused on the health technology sector and the owner of AxioMed, a health tech company that has developed the technology known as the Freedom Cervical disc. AxioMed was founded to advance the standard of care for patients with degenerative spine conditions and has now successfully developed the artificial disc that most closely mimics the normal disc using viscoelastic polymer technology.

In disc replacement, worn or damaged disc material between the small bones in the spine (vertebrae) is removed and replaced with a synthetic or ‘artificial’ disc. The goal of the procedure is to relieve back pain while maintaining more normal motion than is allowed with some other procedures, such as spinal fusion. The Freedom Cervical disc is said to most closely mimic the natural properties of a healthy human disc and has been proven to withstand the forces and wear of decades of use.

On February 1, Dr Chin operated on a female patient with a prolapsed disc who would’ve been in need of several surgical procedures with sequential disc replacement or a fusion of the discs, which would’ve limited her neck motion.

For the procedure, he worked with his team of University of the West Indies (UWI) and Oxford-trained Rhodes Scholar Dr David Walcott, UWI & Yale-trained neurosurgeon Dr J Geoffrey Liburd, and anesthesiologist Dr Patrick Toppin.


READ THE REST HERE